Optical coherence tomography angiography generates high-resolution images of the microvasculature by using high-speed OCT to repeatedly scan an area and detect the movement of red blood cells, using blood flow as an intrinsic contrast agent of blood vessels. Coupled with structural imaging, it provides us with a unique perspective of the blood vessels at different tissue layers. OCTA is emerging as a valuable tool in the diagnosis and management of glaucoma, particularly in cases of pre-perimetric glaucoma, glaucoma with high myopia, glaucoma with paracentral loss and advanced glaucoma. Here, I’ll discuss the advantages and limitations of OCTA, its role in different stages of glaucoma and its potential to complement structural OCT in improving the diagnosis and management of glaucoma.
Regions of Interest
There are three regions of interest for OCTA in glaucoma:
1. Superficial peripapillary region. This region extends from the internal limiting membrane to the retinal nerve fiber layer/ganglion cell layer. Structural OCT is first used to guide the selection of this layer for OCTA imaging. Then, large blood vessels are removed to focus on measuring vessel density of the microvasculature.
2. Choroidal vasculature. The parapapillary choroidal region extends from the retinal pigment epithelium to the choroid.
3. Superficial macular vasculature. This region extends from the internal limiting membrane to the inner plexiform layer.
Useful Settings
OCTA can come in handy when structural OCT falls short in situations such as diagnosing per-perimetric glaucoma, glaucoma with high myopia, glaucoma with paracentral loss and advanced glaucoma.
• Pre-perimetric glaucoma. OCTA can be a useful adjunct for diagnosing glaucoma in patients who haven’t yet demonstrated visual field loss. In this pre-perimetric population, the superficial peripapillary vessel density is decreased compared to the normal population. Based on one study, OCTA performed better than structural ganglion cell complex OCT to diagnose pre-perimetric glaucoma.1 Another study reported better diagnostic accuracy with OCTA than RNFL OCT.2 Other studies have shown similar performance between OCTA and structural OCT. OCTA is at least comparable to structural OCT, and may at times be more useful.
• High myopia. In patients with high myopia, RNFL OCT can be affected by artifacts, making it difficult to distinguish between true disease-associated thinning and artifacts. In contrast, vessel density doesn’t show attenuation in a healthy myopic eye. In an eye with high myopia and glaucoma, OCTA can show a decrease in vessel density in affected areas, indicating deficits due to glaucoma, such as an inferotemporal defect.3 It’s not an automated algorithm to measure these vessel density deficits, however. The authors who reported the good diagnostic ability of OCTA for discriminating high myopia-glaucoma eyes from healthy high myopia eyes integrated widefield SS-OCT and OCTA scans, ultimately resulting in the OCTA-PanoMap.3 Furthermore, they examined both the peripapillary region and macular region together and manually graded the OCTA images.
Another study demonstrated that when comparing highly myopic eyes with different glaucoma severities based on visual field, similar amounts of RNFL thinning may be observed, again, due to some of these artifacts with structural OCT in highly myopic eyes. On OCTA, however, peripapillary vessel density seemed to correlate better globally and regionally with visual field loss than peripapillary RNFL thickness, and the authors suggested that this OCTA parameter may be useful in monitoring disease progression in high myopes.4
 |
| Figure 1. OCTA can detect paracentral loss before structural OCT. In the peripapillary OCTA of the eye with paracentral loss, the vessel density deficit is in the inferotemporal quadrant. In the eye with peripheral loss and similar mean deviation to the eye of paracentral loss, the OCTA doesn’t show any obvious defect in the peripapillary microvasculature. |
• Paracentral loss. My colleagues and I performed a study comparing OCTA in 33 POAG patients with paracentral loss (n=15) or peripheral loss (n=18) and 31 controls, all of whom underwent peripapillary SS-OCTA.5 We found that on OCTA, patients with paracentral loss tended to have clearly indicated microvasculature deficits in the affected hemisphere (p=0.001), whereas in those with peripheral loss, despite having similar mean deviation, a deficit wasn’t obvious (Figure 1). Our study also showed that OCTA had better correlation with paracentral total deviation (a functional measurement of paracentral loss) compared to RNFL thickness measured by structural OCT.
In another study, we demonstrated the predictive utility of a combined model of OCTA and structural OCT parameters for severity of paracentral visual field loss.6 Of the four models we tested to predict affected paracentral total deviation, the one containing minimum BMO-MRW and OCTA flow was superior.
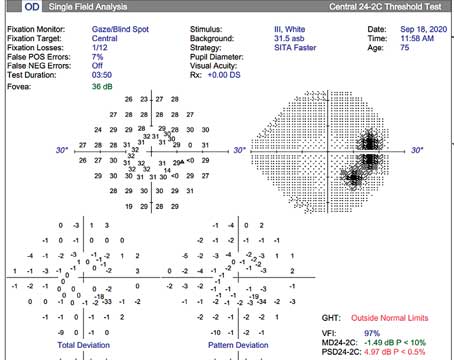
What role does OCTA play for a patient with known paracentral loss based on their visual field? Since OCTA can detect paracentral loss before it’s evident on structural OCT, it can be particularly useful for patients who are unable to perform a reliable visual field test, instead of waiting another six months for a repeat visual field to confirm paracentral loss (Figure 2).
Others have found that choroidal microvascular drop-out is associated with paracentral loss.7 Additionally, a deep learning model using OCTA of the superficial macular region showed greater accuracy in predicting visual field loss in the central part (10-2) compared to structural OCT models (R2 of 0.85, MAE of 1.76 dB).8
• Advanced glaucoma. As glaucoma progresses, macular vessel density tends to decrease. In cases of advanced glaucoma, the GCIPL thickness may reach the floor while macular vessel density continues to decrease in eyes with worse mean deviation.9 In contrast to structural OCT, OCTA doesn’t show a significant floor effect and remains a useful modality for monitoring advanced-stage progression, particularly when mean deviation is worse than -14 dB.
 |
| Figure 2. A defect (orange arrow) on OCTA is detectable earlier than on structural OCT in a patient with paracentral visual field loss. Using OCTA may allow for more rapid identification of certain glaucoma subtypes, especially in cases where patients can’t perform reliable visual field tests (left). The same patient performed a reliable VF test again six months later, and the paracentral loss was evident (red outline, center). |
Dynamic Range
Interestingly, OCTA has demonstrated utility at both ends of the glaucoma progression spectrum, from pre-perimetric to advanced disease. However, it’s important to consider the number of steps within the dynamic range of a parameter. Although OCT parameters such as RNFL reach the floor earlier than OCTA parameters such as vessel density, there are more steps within the dynamic range of RNFL. Hence, as much as OCTA is helpful for early and advanced glaucoma, we have to consider the fact that its dynamic range may be limited due to inter-visit variability.10
Predicting Progression
In addition to aiding diagnosis, baseline OCTA is helpful for predicting glaucomatous progression. Choroidal microvascular drop-out (focal sectorial capillary drop-out) is associated with subsequent disc hemorrhage and progressive RNFL thinning.11,12 Lower peripapillary vessel density at baseline can also predict progressive RNFL and GCC thinning in POAG.13,14
 |
| Figure 3. A cooperative study patient with good visual acuity had a series of OCTA scans affected by artifacts over the years, limiting our ability to track progression. Quality scores for years 2017 and 2020 to 2023 were 66, 31, 69, 61 and 70, respectively. A quality score >40 is considered good. |
Artifacts
Tracking progression is a different story. OCTA can be affected by artifacts, impacting the quality and reliability of scans. In one study of 5,263 OCTA images, 33.9 percent had poor quality.15 Of those with acceptable quality (QS ≥4), 23.4 percent had artifacts. A total of 41 percent of glaucoma eyes had artifacts. The most common artifacts were segmentation error, eye movement in healthy patients, blink and Z-offset. HD images had fewer artifacts. Older age, male sex, worse MD, absence of eye tracking and macular scan area were associated with increased chances of obtaining poor-quality scans.
Because of the preponderance of artifacts, OCTA may not yet be useful for tracking glaucoma progression. Figure 3 shows an example of one of our study patients. This patient had good visual acuity and good cooperation, yet many of her images had artifacts over the years, affecting our ability to track progression.
The Bottom Line
OCTA has much to offer glaucoma patients and our burgeoning understanding of glaucoma pathogenesis. We can use OCTA to complement structural OCT.16 Whenever possible, look at and learn from OCTA images, especially those of patients with high myopia, paracentral loss or advanced disease. OCTA is mainly available on four devices—Triton (Topcon), AngioVue (Optovue), AngioPlex (Cirrus) and Spectralis (Heidelberg)—and most but not all provide automated quantification. However, OCTA measurements from different devices aren’t interchangeable. Hence, it’s important to use the same device for consistent measurements. Also be sure to understand the limitations of OCTA, including the prevalence of imaging artifacts and its limited ability to track progression over time.
Dr. Shen is the director of the Glaucoma Fellowship at Massachusetts Eye and Ear and is an associate professor of ophthalmology at Harvard Medical School. She is a consultant and advisor to FireCyte.
Dr. Singh is a professor of ophthalmology and chief of the Glaucoma Division at Stanford University School of Medicine. He is a consultant to Alcon, Allergan, Santen, Sight Sciences, Glaukos and Ivantis. Dr. Netland is Vernah Scott Moyston Professor and Chair at the University of Virginia in Charlottesville.
1. Kumar S, Anegondi N, Chandapura RS, et al. Discriminant function of optical coherence tomography angiography to determine disease severity in glaucoma. Invest Ophthalmol Vis Sci 2016;57:6079-6088.
2. Kamalipour A, Moghimi S, Jacoba CM, et al. Measurements of OCT angiography complement OCT for diagnosing early primary open-angle glaucoma. Ophthalmol Glaucoma 2022;5:3:262-274.
3. Kim YJ, Na KI, Lim HW, et al. Combined wide-field optical coherence tomography angiography density map for high myopic glaucoma detection. Scientific Reports 2021;11:22034.
4. Shin JW, Kwon J, Lee J, et al. Relationship between vessel density and visual field sensitivity in glaucomatous eyes with high myopia. Clin Sci 2019;103:585-591.
5. Nascimento e Silva R, Chiou CA, Wang M, et al. Quantification of the peripapillary microvasculature in eyes with glaucomatous paracentral visual field loss. Ophthalmology Glaucoma 2021;4:286-294.
6. Xu C, Saini C, Wang M, et al. Combined model of OCT angiography and structural OCT parameters to predict paracentral visual field loss in primary open-angle glaucoma. Ophthalmology Glaucoma 2023;6:3:255-265.
7. Kwon J, Shin J, Lee J, et al. Choroidal microvasculature dropout is associated with parafoveal visual field defects in glaucoma. Am J Ophthalmol 2018;188:141-154.
8. Mahmoudinezhad G, Moghimi S, Cheng J, et al. Deep. Learning estimation of 10-2 visual field map based on macular optical coherence tomography angiography measurements. Am J Ophthalmol 2024;257:187-200.
9. Song WK, Kim KE, Yoon JY, et al. Association of macular structure, function, and vessel density with foveal threshold in advanced glaucoma. Scientific Reports 2022;12:19772.
10. Moghimi S, Bowd C, Zangwill LM, et al. Measurement floors and dynamic ranges of OCT and OCT angiography in glaucoma. Ophthalmology 2019;126:7:980-988.
11. Kim CY, Lee EJ, Kim J, et al. Progressive retinal nerve fiber layer thinning and choroidal microvasculature dropout at the location of disc hemorrhage in glaucoma. British Journal of Ophthalmology 2021;105:674-680.
12. Kim J, Lee EJ, Kim T, et al. Evaluation of parapapillary choroidal microvasculature dropout and progressive retinal nerve fiber layer thinning in patients with glaucoma. JAMA Ophthalmology 2019;137:7:810-816.
13. Rao HL, Dasari S, Puttaiah NK, et al. Optical microangiography and progressive retinal nerve fiber layer loss in primary open angle glaucoma. Am J Ophthalmol 2022;233:171-179.
14. Rao HL, Sasari S, Puttaiah NK, et al. Optical microangiography and progressive ganglion cell-inner plexiform layer loss in primary open-angle glaucoma. Am J Ophththalmol 2022;238:36-44.
15. Kamalipour A, Moghimi S, Hou H, et al. OCT angiography artifacts in glaucoma. Ophthalmology 2021;128:10:1426-1437.
16. Braun M, Saini C, Sun JA, Shen LQ. The role of optical coherence tomography angiography in glaucoma. Semin Ophthalmol 2024;1-12. [Epub ahead of print].