Going Beyond Topography
There’s no question that topography is still the mainstay when it comes to screening. “Careful screening of refractive surgical patients for the risk of postoperative ectasia continues to be important in clinical practice,” says Stephen D. Klyce, PhD, adjunct professor of ophthalmology at Mt. Sinai University School of Medicine in New York City. “Trained use of Placido topography remains the most reliable and sensitive method for detecting the earliest changes associated with keratoconus. With the emphasis placed on proper fixed, standard scales and contrasting color palettes to avoid interpretation errors, nearly all corneas with early signs of keratoconus can be detected.”1
At the same time, there’s been a proliferation of new instruments that can provide relevant information. “In recent years, anterior segment imaging has evolved significantly,” says A. John Kanellopoulos, MD, clinical professor of ophthalmology at NYU Medical School in New York and medical director of the Laservision.gr Institute in Athens, Greece. “Today it involves several technologies besides traditional topography and tomography. We currently use a large number of other anterior segment imaging devices, including anterior segment OCT and the HD Analyzer—the latter being an optical scatter measuring device—to better evaluate the tear film and the clarity of both the cornea and the intraocular lens.
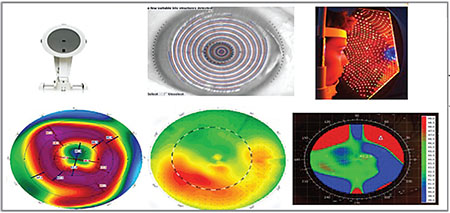 |
| It’s important to consider how each technology gathers its information when interpreting the result. This patient had a simple case of central cloudy dystrophy (Francois). The Pentacam (left), which uses Scheimpflug cross-sections of the cornea to generate its topographic map, is affected by the cloudiness and shows a significant central depression that’s not really there. In contrast, both Placido and Cassini’s reflection-based technologies are able to make accurate measurements. |
“Each anterior segment imaging device has advantages and disadvantages,” he continues. “Classic Placido disc topography doesn’t provide any data regarding corneal thickness or posterior corneal curvature, but it gives us good anterior curvature maps. It’s very accurate in an eye that has a good tear film, even if the cornea has opacities. Corneal tomography, which evolved from the original Orbscan to today’s Pentacam and other Scheimpflug devices, can produce pachymetry maps of the cornea, showing the anterior and posterior elevations. This technology gives us a three-dimensional diagnostic modality, allowing earlier diagnosis of ectasias and significant corneal irregularities. It can also calculate total corneal power, which is normally in the 43- to 45-D range. However, these instruments depend on corneal clarity, so any disruption of clarity will cause them to work suboptimally.
“The new kid on the block is the multicolor LED-reflection topography device called Cassini,” he continues. “Cassini does ray-tracing on every three of 700 spots that are projected onto the cornea, imaged and then analyzed. Notably, this provides good central cornea data; Placido disc imaging doesn’t give us any central cornea data because curvature calculation starts from the first Placido disc, not from the center. The Cassini also offers some posterior curvature data to use as a second data source to compare with Pentacam data or data from other types of anterior segment imaging.”
Dr. Kanellopoulos notes that many of these devices have their own software, programmed to help the clinician detect irregularities. “Our group has reported what may be the largest evaluation of the different parameters associated with keratoconus, in a study using these technologies to evaluate more than 1,000 keratoconic eyes,” he says. “We found that the ‘index of height decentration,’ a corneal symmetry index available in the Pentacam and many other topography devices, is probably the most sensitive tool for diagnosing early ectasia and ectasia progression—with the exception of very centrally located cones. Also very helpful for diagnosing early ectasia is a well-known software program created by Belin and Ambrosio that evaluates the qualitative transition of corneal pachymetry, found on the Pentacam. In the final analysis, however, the surgeon’s eye and experience may be the best way to detect irregular corneal pachymetry map patterns, no matter how sensitive these software programs are.”
Working With the Technology
The following strategies can help ensure that problematic eyes don’t end up undergoing surgery:
• Don’t screen patients without using a tomographic analysis. “Today I think it’s generally accepted that patients need to be screened with a tomographic device—in other words, an instrument that can analyze more than just the front surface of the cornea,” says Michael W. Belin, MD, professor of ophthalmology and vision science at the University of Arizona in Tucson. (Dr. Belin, working with Renato Ambrosio, MD, developed the Belin/Ambrosio Enhanced Ectasia Display—sometimes called the BAD display—which was incorporated into the Oculus Pentacam and is now one of the most commonly used refractive surgery screening tools.) “Without that capability, you’re conducting less than half an exam,” he says.
At the same time …
• Don’t rely solely on tomographic data. Dr. Klyce points out that four different technologies can currently be used to obtain topographic information. “Several new instruments sport both Placido and slit-scan capabilities,” he says. “They have the potential to provide accurate corneal topography, pachymetry and endothelial elevation data. In terms of topographic representation, listing them from most sensitive and faithful to least, they are: grid-style reflection topographers; traditional Placido disk topographers; very high resolution swept-source OCT; and corneal curvature derived from slit-scan elevation measurements.”
Dr. Klyce notes that abnormal corneal topography is the highest risk factor for the development of ectasia following refractive surgery,2 so proper interpretation of corneal topography is important. “While risk factors have been found to include corneas less than 510 µm thick, a residual stromal bed less than 250 µm, being less than 26 years of age and myopic corrections greater than -8 diopters, it’s been proven that recognition of corneal abnormality in topography outweighs the other risk factors,” he says. “Recently there’s been a trend toward using non-Placido slit-scan tomographers alone to assess the corneal status. That trend is understandable because helpful adjunct information such as accurate corneal thickness profiles—and for the cataract surgeon, endothelial astigmatism—can be derived using this modality. However, it’s clear that when low-sensitivity corneal tomography exams are used rather than reflection-based corneal topography, experts’ ability to recognize abnormal topography is challenged.”3
• Consider using an all-in-one instrument that can obtain multiple kinds of data. “When performing refractive surgery, a good reflection topographer and a good tomographer are essential, and these capabilities can be combined into a single instrument,” says Dr. Klyce. “For the refractive cataract surgeon, it’s ideal to use an instrument that can perform good reflection topography; has slit-scanning capabilities to measure corneal pachymetry, endothelial astigmatism and anterior chamber depth; and can measure axial length. Recently, all-in-one instruments that can provide all of these data in one platform have been introduced. In addition, for the clinical scientist, some instruments now available can also measure phakic and pseudophakic intraocular lens tip, tilt and centration. With careful evaluation for accuracy, the all-in-one instruments are especially attractive for their efficiency in terms of exam time and instrument space requirements.”
• Remember that OCT is the most accurate way to measure corneal thickness. “We’ve published reports comparing tomographic and OCT measurements of corneal thickness,” says Dr. Kanellopoulos. “Comparing them side-by-side, OCT is far more accurate. It’s only a matter of time before most spectral-domain OCTs will have an anterior segment option available, which will enable clinicians not only to use this technology for very accurate macula and retina imaging, but also for very accurate anterior segment diagnosis and treatment.”
• Keep in mind how each instrument is generating the data it gives you. “It’s important to understand how each technology generates its map,” Dr. Kanellopoulos points out. “Different instruments may produce a very different map of the same eye. If you understand what each device is doing, you can interpret the scan appropriately. For example, the patient in the figure on p. 23 has Central Cloudy Dystrophy of Francois, causing a benign clouding of the central cornea. The Pentacam scan, which uses Scheimpflug cross-sections of the cornea to generate its map, is biased by the cloudiness and shows a significant central depression that’s not really there. However, both Placido and Cassini topography are able to make accurate measurements.”
• Because measurements made with different technologies may not agree, remember that your experience with a given technology matters. “Accurate gold standards are available for reflection corneal topography,” says Dr. Klyce. “However, once data is derived from images or signals passing through the eye, assumptions must be made regarding the index of refraction along the pathway of the probing beam or ray. A good example of this uncertainty is the average central corneal thickness measured with ultrasound—approximately 560 µm—vs. the average CCT measured with confocal microscopy or slit-lamp pachymeters, which is approximately 520 µm. That’s a 40-µm difference. The bottom line is that clinical experience with a specific instrument is necessary in order to obtain reliable results. So, when updating or converting to a newer technology, be careful to ensure that the new data are equivalent to the old. If they’re not equivalent, be sure that conversion tables are available.”
• Consider imaging the corneal epithelium with OCT. “Imaging the corneal epithelium with anterior segment OCT is easy and clinically useful,” notes Dr. Kanellopoulos. “Our group has reported on this extensively. We believe that doing this is pivotal, not just for refractive surgeons but for ophthalmologists in general. The corneal epithelium appears to be very uniform in most healthy patients of any age, sex and refractive error, so any deviation from uniformity in the corneal epithelium points to ocular disease, whether it’s dry eye, early keratoconus, trauma, blepharitis or some other disturbance.
“Up until recently, imaging the corneal
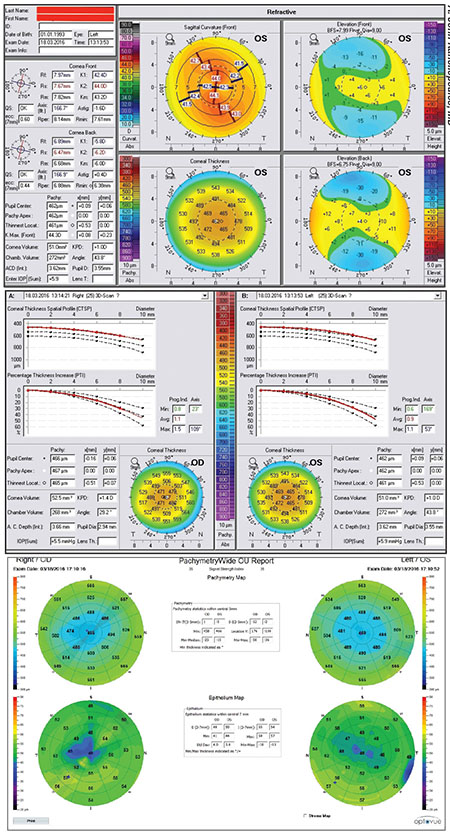 |
| Imaging the corneal epithelium may reveal important details relevant to screening and treatment decisions. This 22-year-old male had 20/20 vision OU, but had a brother with keratoconus. A Pentacam scan shows only regular, thin corneas, but OCT epithelial maps confirm keratoconus (thinning over the cone), hidden by epithelial remodeling. |
“In general, anterior segment OCT is a very useful tool for following refractive surgery patients,” he adds. “It can reveal a lot about how transient dry eye affects quality of vision, as well as the progress that occurs following any interventions the ophthalmic surgeon decides to make.”
• Remember to consider the age of the patient. “We all know that age is an important factor in determining whether or not someone is an appropriate refractive surgery candidate,” says Dr. Belin. “If someone is 55 years old, we’re willing to accept a lot more leeway in some of our measurements than if the patient is 19. Up to now, the BAD test has not accounted for this factor, so surgeons had to remember to account for the patient’s age when deciding whether to proceed. An age-adjusted display is something we’d like to incorporate into the next version of the test.”
• High asymmetry between the eyes is a red flag. “This should always be a sign to proceed with caution,” notes Dr. Belin. “To use an analogy, if patients come into your office with intraocular pressures of 12 mmHg in both eyes, or even 19 mmHg in both eyes, you probably wouldn’t be concerned. But if they had pressures of 12 in one eye and 19 in the other, you’d probably want to follow them. It’s true for most things in medicine: Asymmetry is a red flag.”
• Keep in mind that dry eyes can cause bogus tomographic and OCT readings. “Surgeons often overestimate corneal thickness and the irregularity of posterior corneal curvature in tomographic maps and OCT scans when the patient has dry-eye syndrome,” says Dr. Kanellopoulos. “A dry eye creates epithelial injury and significantly skews the Scheimpflug imaging. Thus it’s very common to have irregular Pentacam and OCT pachymetry maps that do not accurately represent the true pachymetry in dry eyes.”
• Don’t depend too much on screening tests. “This may seem strange, given that I’ve developed a number of screening tests, but the biggest mistake I think surgeons make is becoming too dependent on the displays,” says Dr. Belin. “The displays are there to assist the physician, not to replace the physician. You need to look at a number of other factors when evaluating a patient, including age, family history, ablation depth and the amount of correction needed. The display is there to assist your decision-making process, but it shouldn’t have the final say.”
Screening: The Next Level
With the advent of collagen cross-linking availability in the United States, American doctors’ ability to treat ectasia and keratoconus has taken a giant leap forward. That, in turn, has made it important to be able to go beyond simply determining that an abnormality is present—the goal of basic screening—to being able to determine exactly what is wrong and whether the process is progressive. “Cross-linking has been available for more than a decade outside the United States, and we see two common but opposite problems: too many people with nonprogressive disease being treated who probably do not require treatment, and too few who have progressive subclinical disease receiving treatment early enough to prevent loss of visual quality,” says Dr. Belin.
“About a year and a half ago Dr. Ambrosio and I participated in the Global Consensus on Keratoconus and Ectatic Diseases project, which invited ophthalmic experts from around the world to reach a consensus about the definition and management of keratoconus and ectatic disease,” he says. “That work resulted in an article published in Cornea last year.4 One of the major conclusions of the consensus document was that we still don’t have an adequate way of classifying or staging ectatic disease. That’s become a particularly important issue with the advent of collagen cross-linking. So, for the past two years we’ve been working on this, and about six months ago we released a new classification system that we call the ABCD system, currently available on the OCULUS Pentacam. (See illustration, right.) It can be incorporated into any tomographic system that’s able to measure both the anterior and posterior surfaces.”
Dr. Belin notes that most ophthalmologists continue to use the Amsler-Krumeich classification system to stage ectatic disease. “That was first described about 70 years ago, yet people still refer to it in published papers,” he points out. “It uses a parameter called K-max to determine when and if progression has occurred. The problem with K-max is that it’s an anterior-cornea parameter. That means that in order to detect progression, the anterior surface must have changed, so by the time you detect progression the patient has already lost visual acuity. Our goal should be to prevent the loss of vision, not to halt a decrease that’s already occurring. To do that, we need to be able to identify progressive disease at a much earlier stage.
“Compare this to oncology,” he continues. “Oncologists classify disease today based on a very detailed staging mechanism: whether you have nodes; whether you have hormone receptors; the extent of the disease; whether it’s contiguous or noncontiguous; and other factors. The system we continue to use to stage ectatic disease is based on data from a keratometer and an optical pachymeter. And we wonder why we can’t come up with a good description of how we treat this disease.”
Describing the Disease
Dr. Belin explains that in the ABCD classification system, each anatomical part of the cornea is individually described. “ ‘A’ stands for the anterior radius of curvature, taken from a 3-mm zone centered on the thinnest point on the cornea,” he says. “ ‘B’ stands for the back of the cornea, meaning the posterior radius of curvature, also based on the 3-mm optical zone that’s centered on the thinnest point. ‘C’ stands for corneal thickness at the thinnest point. (In contrast, the Amsler-Krumeich system uses the central corneal thickness.) ‘D’ stands for distance visual acuity. The ABCD system allows you to describe each factor independently, graded from 0 to 4.”
Dr. Belin says that part of the challenge of creating the ABCD test was determining the inherent noise level of the four parameters. “We did that using two different patient populations: a known keratoconic population and a normal population,” he says. “The reason we used
 |
| The new Belin ABCD Keratoconus Staging Display allows the clinician to describe the cornea’s condition based on four measurements, graded 0 to 4. Above: A typical patient with advanced subclinical disease. The anterior surface is normal (A0), while the posterior surface has a marked ectatic change (B4) accompanied by moderately advanced corneal thinning (C3). Because the anterior surface is normal, the distance visual acuity is good (D0). |
“Our ultimate goal was to create a progression display that allows you to track change over time and document improvement after treatment such as cross-linking,” he continues. “The new Belin ABCD Progression Display allows you to graphically display both an 80 and 95 percent confidence interval, for both a normal and a keratoconic population. (See example, above.) That will allow you to determine when and if true, statistically significant change has occurred. The goal of this, again, is to be able to identify very early disease, finding changes in either corneal thickness or the posterior surface before loss of vision has occurred. That should allow us to treat patients early enough to prevent vision loss, while avoiding unnecessary treatment in older patients with static disease.”
How BAD Works With ABCD
Dr. Belin says the ABCD classification and staging system and the BAD display are somewhat different but complementary. “The BAD test is designed to separate normal from abnormal patients,” he explains. “It gives you a number that tells you how far from normal the patient is, but it doesn’t describe the condition of the disease or help you determine where and when progression is occurring.
“To use an analogy, the BAD display is like the ‘check engine’ light in your car,” he says. “It tells you that something is wrong, but it doesn’t tell you what the problem is. The ABCD displays are more geared toward analysis of the problem. So, for example, if someone comes to see me for refractive surgery, my first concern is: Are you an appropriate candidate or not? If the BAD test indicates that the person is abnormal, then I won’t do refractive surgery. Nevertheless, that individual needs further evaluation to determine exactly why the eye is abnormal, and more important, whether the abnormality is progressive.
“I wouldn’t pursue that in the refractive part of my practice, partly for practical reasons and partly because of insurance, but I would have that individual examined in the medical portion of my practice,” he continues. “That’s the point at which the ABCD classification system and the progression display would be most useful. It will provide information relevant to proceeding with cross-linking, refractive surgery, intracorneal rings or DALK, because just as with breast cancer, we need to be able to stage the disease to properly determine what the treatment should be.
“To illustrate the importance of this for a surgeon who performs combined cross-linking and refractive surgery,” he continues, “suppose your patient has an advanced case of posterior ectasia. He might be an appropriate candidate for cross-linking, but you wouldn’t want to combine refractive surgery and cross-linking because the anterior surface is normal. And of course, the ABCD system can be used thereafter to monitor progression; the BAD test cannot.”
Dr. Belin says many patients could potentially benefit from this. “Patients who have very early-stage disease that hasn’t affected their vision yet won’t normally seek medical care, because they’re asymptomatic,” he points out. “However, they often seek refractive surgery, where hopefully they will be screened as abnormal. As more refractive surgeons offer cross-linking to their patients, all of these tests should be of great use to them.” Dr. Belin says the new ABCD progression display should be available this spring.
The Evolution Continues
Dr. Klyce notes that, despite the potential for conflicting data from the various technologies, the incidence of postoperative ectasia is low and may be declining. “The combination of appropriate color maps that display corneal curvature and interpretive software programs trained to recognize different corneal abnormalities has helped clinicians to differentiate between normal topography and variations that signal abnormalities,” he says.
“Meanwhile, modalities other than topography and pachymetry for detecting at-risk corneas are also under active investigation,” he continues. “Reinstein and collaborators have shown that patterns characteristic of keratoconus can be observed in corneal epithelial profiles using very high frequency ultrasound.5 Since ectasia is the consequence of a biomechanical failure of the corneal stroma, it’s heartening that corneal biomechanics are being extensively studied. New keratoconus-detection algorithms have been developed combining corneal biomechanical response data with corneal tomographic data, leading to excellent discrimination.6 Using a materials-science approach to model the viscoelastic properties of the corneal stroma, researchers have been able to predict specific corneal shape changes in individual corneas with known risk factors.7
 |
| The new Belin ABCD Progression Display may make it easier to monitor the progression of ectatic disease over time. This display shows five exams, two prior to cross-linking and three after treatment. In this patient, it reveals statistically significant progression on both the anterior and posterior corneal surfaces, as well as progressive thinning; it documents significant improvement post-cross-linking. In addition to the graphic display, the table shows how a number of other commonly used parameters have changed. |
“Whether this approach will ever be sensitive enough to detect the very early structural weakening that underlies the subtle curvature changes detected with topography remains to be seen,” he adds. “However, when instruments provide accurate data from both imaging technology and biomechanical measures, these data can be combined to develop expert systems whose aim is to recognize corneal risk with a greater predictive value than can be obtained from a single type of measure.”
Dr. Belin is a consultant to Oculus, but receives no compensation for sales of instruments using his displays. Dr. Klyce is a consultant for Nidek. Dr. Kanellopoulos is a consultant for Avedro and Alcon.
1. Wilson SE, Klyce SD, Husseini ZM. Standardized color-coded maps for corneal topography. Ophthalmology 1993;100:1723-1727.
2. Randleman JB, Woodward M, Lynn MJ, Stulting RD. Risk assessment for ectasia after corneal refractive surgery. Ophthalmology 2008;115:1:37-50.
3. Ramos IC, Correa R, Guerra FP, et al. Variability of subjective classifications of corneal topography maps from LASIK candidates. J Refract Surg 2013;29:770-5.
4. Gomes JA, Tan D, Rapuano CJ, Belin MW, et al. Global consensus on keratoconus and ectatic diseases. Cornea 2015;34:4:359–369.
5. Reinstein DZ, Gobbe M, Archer TJ, Silverman RH, Coleman DJ. Epithelial, stromal, and total corneal thickness in keratoconus: Three-dimensional display with Artemis very-high frequency digital ultrasound. J Refract Surg 2010; 26:259-271.
6. Vinciguerra R, Ambrósio R Jr, Elsheikh A, et al. Detection of keratoconus with a new biomechanical index. J Refract Surg 2016;1:32:12:803-810.
7. Dupps WJ Jr, Seven I. A large-scale computational analysis of corneal structural response and ectasia risk in myopic laser refractive surgery. Trans Am Ophthalmol Soc 2016;114:T1.