The Disease's Progression
The average age of the population in developed nations (as classified by the United Nations) went from 29 in 1950, to 37.3 in 2000 and is predicted to increase to 45.5 in 2050.1 Globally, the average age was 23.9 in 1950 and grew to 26.8 in 2000, with a predicted rise to 37.8 by 2050. In our aging population, identifying leading indicators of AMD is crucial, since, from the ages of 50 to 75, the incidence of AMD increases by almost 50 percent.
The majority of AMD patients have the "dry" form, which can range from mild to severe. Neovascular, or "wet" AMD, affects only about 10 percent of the AMD patient population and represents the advanced stages of the disease.
Dry AMD results from the gradual thinning of the retinal pigment epithelium and the degeneration of photoreceptors in the macula, which causes blurring of central vision over time.
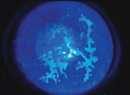
A common early sign of AMD is drusen. Specifically, drusen, which are yellow-white deposits of waste from photoreceptor cells, collect in the RPE layer under the retina. As such, the drusen are believed to hinder the functioning of the photoreceptors, and can result in progressive degeneration of the photoreceptor cells in the macula. This early form of the disease develops more slowly than wet AMD, and is functionally observed as a gradual loss of central vision. For instance, patients may experience difficulty reading, watching television and recognizing people, objects and scenes.
Conversely, wet AMD develops aggressively; abnormal blood vessels behind the retina grow under the macula and often leak blood and fluid. Fluid accumulates under the retina, raising the macula from its normal position and damaging it, often resulting in rapid loss of vision.
Typically, both dry and wet AMD may be diagnosed in office by examining the retina with an ophthalmoscope and measuring visual acuity. Fluorescein angiography is also helpful for identifying abnormal blood vessels in the choroid. Another valuable technique is ocular coherence tomography. This technology provides a cross-sectional image of the retina and is used in-office and in clinical trials to morphologically investigate eyes with AMD.
The Limitations of Eye Tests
At home, patients may also be advised to test their own eyesight for signs of AMD with the Amsler grid test, which may reveal early signs of AMD. However, this test's findings are subjective in nature because there is no baseline to which results may be compared. Consequently, a more reliable yet readily accessible leading indicator is needed.2
Clinical trials in AMD tend to use the ETDRS best-corrected visual acuity chart as the primary clinical endpoint for AMD disease progression and drug efficacy. This chart was first used in the Early Treatment of Diabetic Retinopathy Study, and was created to increase the accuracy of earlier tests, such as Snellen, by incorporating letters of equal difficulty, the same number of letters per row (five), equal spacing between the rows on a log scale (0.1 log unit), and equal spacing of the letters on a log scale.
Visual function, however, consists of much more than visual acuity. As the visual system is extremely complex, there may be earlier indicators of AMD than those we are currently using to diagnose patients and monitor their progression. Patients are typically diagnosed after a change in best-corrected visual acuity has occurred. Using this as a primary endpoint, few clinical trials have led to the approval of new drug therapies.
Research has been more successful in the area of wet AMD than dry. Wet AMD can be treated with laser and photodynamic therapies to stop leaking blood vessels in the choroid. Anti-vascular endothelial growth factor (VEGF) drugs such as Macugen (pegaptanib sodium, OSI/Eyetech) and Lucentis (ranibizumab, Genentech) have been a welcome addition to the wet AMD armamentarium with their ability to prevent further neovascularization. Many more drugs (e.g. the VEGF-Trap, Regeneron) are making their way through the pipeline as well.
Other than using antioxidants and zinc as possible preventive measures, however, there are no known drugs available for treating dry AMD. The Age-Related Eye Disease Study suggested that ocular vitamins (antioxidant vitamins plus zinc supplements) may be useful in slowing the progression of the disease in patients with more severe AMD, which included certain patients in the dry AMD category. These patients were defined, on a whole, as having numerous intermediate drusen, large drusen, or noncentral geographic atrophy in one or both eyes, or advanced AMD or vision loss due to nonadvanced AMD in one eye.3
Developing an effective diagnostic tool that will ultimately pave the way for therapies in dry AMD requires a visual function leading indicator other than BCVA. Such a leading indicator could enable the identification of proper subpopulations for clinical testing and allow researchers to track disease progression in relation to treatment effects. An earlier leading indicator would not only be useful in the drug development process, but could help to identify potential AMD patients before the patients show any disturbance in visual acuity.
The Promise of Newer Tests
Where does one find a leading indicator to help identify potential AMD patients? Previous research on the topic has investigated a host of potential tests ranging from measures of contrast sensitivity to short wavelength automated perimetry (SWAP). The theoretical grounding for such research is the idea that short wavelength photoreceptors in the retina are likely to show the first signs of degeneration, which suggests that testing their responsiveness may provide the ideal early indicator of visual function degeneration. That is, if decay of these photoreceptors can be measured, AMD may be detectable long before any decay in ETDRS BCVA can be detected.
Visual color perception is determined by a mixture of light wavelengths as they hit the cone photoreceptors in the retina. That is, the retina contains three distinct types of cones, which are able to discern color from the different wavelengths of light in the environment along the protan, deutan and tritan axes (i.e., red: sensitive to long wavelengths of light 580 to 700 nm, green: sensitive to medium wavelengths of light 500 to 560 nm, and blue: sensitive to short wavelengths of light 400 to 480 nm). Certain ganglion cells are stimulated by long wavelength light (detected by red cones) and are inhibited by medium wavelength light (detected by green cones) and, therefore, create the perception that red and green are opposite colors. Conversely, other ganglion cells are activated by input from short wavelength light (detected by blue cones), while inhibited by input from red and green cones, creating the effect that blue and yellow are opposites (i.e., tritan spectrum). This pattern of excitation and inhibition extends into sub-cortical neural circuitry and is ultimately regulated by the visual cortex.
In the visual system, only 5 percent of the ganglion cells are stimulated by the color blue, and therefore blue color vision is a selective and unique component of color perception.4 As there are fewer blue retinal ganglion cells than red or green, one might expect the damage to be the most noticeable in blue-color vision when the macula is attacked by a degenerative disease. This effect is supported by research. Notably, age-related vision defects, such as ocular hypertension,5 are reportedly on the tritan (blue-yellow) axis. Unlike its red and green counterparts in the color vision system, the blue-yellow component has little redundancy in hue (the dimension of color) detection. Therefore specific deficits in color discrimination on the tritan axis are likely to reflect localized deficits, ultimately offering insight into the pattern and spread of degeneration over time. Moreover, epidemiological research suggests that AMD is directly related to the damage of blue cones in the macula caused by prolonged exposure to bright visible light.6 As such, photoreceptor activity and, in particular, blue cone function, appears to be an integral piece in the AMD puzzle.
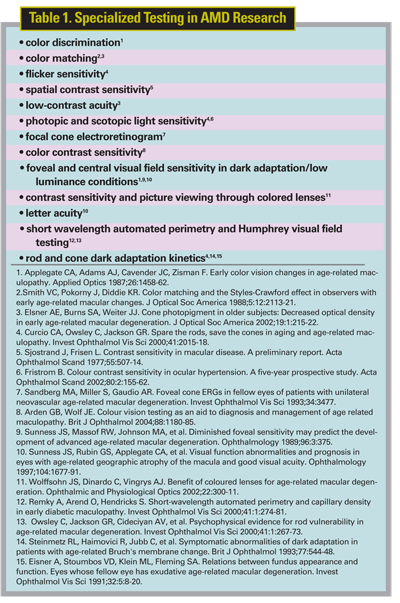
A range of psychometric and psychophysiological testing techniques involving early photoreceptor health has been investigated in AMD research (See table 1).7
Despite this large body of research, however, a reproducible leading indicator has yet to be discovered. It is not sufficient to determine an early indicator of AMD that is only a successful measure under certain conditions and in certain individuals. Instead, a measure that can detect AMD in its most early stages in the majority of individuals is necessary. As such, it appears that it is essential to find a more sensitive measure of short wavelength photoreceptor responsiveness than has previously been explored. Variables such as color, contrast, motion, reaction time and basic-level stimulus encoding could be combined to form a perceptual-behavioral test for AMD. Such a test would be capable of providing a more refined and sensitive measure of photoreceptor activity than previously investigated.
We are currently investigating fine color discrimination abilities at a level of perceptual encoding, as this facet of visual function may enable the measurement of subtle photoreceptor degeneration long before the patient reports changes in visual acuity. Moreover, combining such a test with measurements of visual acuity and foreground-background discriminations would offer an ideal in-office test, much more sensitive than the current behavioral measures.
Recent advances in measures of electrophysiology have allowed for the topographic mapping of retinal response by means of the multifocal electroretinogram. Multifocal ERG simultaneously stimulates various retinal locations.8 In contrast to focal ERG, which also measures electrical activity present in the macula, the mERG uses a higher resolution topographical mapping of the macula and surrounding locations. mERG research to date has investigated the impact of retinal diseases on the local responsiveness of the retina.9
Indeed, new ocular electrophysiological research presents promise for highlighting early cases of AMD, although research in this area to date is rather limited. Nevertheless, in an ERG and electro-oculogram (EOG) investigation, data from various light- and dark-adapted conditions were distinctly different between AMD patients and control groups.10 Specifically, ocular action potentials to light stimuli were shown to be reduced in AMD patients as compared to age-matched controls. Additional ERG data from the same study was shown to be a good indicator of advanced AMD, whereas EOG was the better indicator of soft drusen and early AMD.
Visual evoked potentials data from glaucoma research has demonstrated that VEPs to blue-on-yellow were correlated with disease stage.11 A comparable electrophysiological paradigm may be useful when testing early stage AMD patients. It may be that visual function relating to acuity and color perception remains behaviorally intact even though retinal action potentials begin to show signs of reduced amplitude and or changes in latency to letters, colors, patterns and the like. As such, taking advantage of the electrophysiological measures now at hand (in particular the focal and multifocal ERG) will enable the detection of subtle cone decay in the macula.
Ideally, the ultimate early indicator, once determined, will be able to be used as quickly and effectively in clinical trials as in simple in-office diagnoses as a subpopulation identifier, a disease progression tracker and clinical endpoint. Research is booming and the future holds promise for the key leading indicator(s) of a disease that is becoming an increasing threat to our aging population.
Dr. Abelson, an associate clinical professor of ophthalmology at Harvard Medical School and senior clinical scientist at Schepens Eye Research Institute, consults in ophthalmic pharmaceuticals. Dr. Walker is a research associate at ORA Clinical Research and Development.1. United Nations, World Population Prospects: The 2004 Revision Population Database, Population Division, 2004.
2. Zaidi FH, Cheong-Leen R, Gair EJ, et al. The Amsler chart is of doubtful value in retinal screening for early laser therapy of subretinal membranes. The West London Survey. Eye 2004;18:5:503-508.
3. Age-Related Eye Disease Study Research Group (2001). A randomized, placebo-controlled clinical trial of high-dose supplementation with vitamins C and E, beta Carotene, and Zinc for age-related macular degeneration and vision loss: AREDS report no. 8. Arch Ophthalmol 2001;119:1417-36.
4. Urban R. Before you overmedicate. Ophthalmology and Physiological Optics 2000;22:300-11.
5. Fristrom B. Colour contrast sensitivity in ocular hypertension. A five-year prospective study. Acta Ophthalmol Scand 2002;80:2:155-62.
6. Cruickshanks KJ, Klein R, Klein BE. Sunlight and Age-Related Macular Degeneration. Arch Ophthalmol 1993;111:4:514-18.
7. Curcio CA, Owsley C, Jackson GR. Spare the rods, save the cones in aging and age-related maculopathy. Invest Ophthalmol Vis Sci 2000;41:2015-18.
8. Poloschek CM, Sutter EE. The fine structure of multifocal ERG topographies. J Vision 2002; 2:577-87.
9. Bearse MA, Jr., Sutter EE. Imaging localized retinal dysfunction with the multifocal electroretinogram. J Optical Soc America 1996;13:634-40.
10. Walter P, Widder RA, Luke C, et al. Electrophysiological abnormalities in age-related macular degeneration. Arch Clin Exp Ophthalmol 1999;237:962-68.
11. Horn FK, Jonas JB, Budde WM, et al. Monitoring glaucoma progression with visual evoked potentials of the blue-sensitive pathway. Invest Ophthalmol Vis Sci 2002;43:6:1828-34.