When it comes to managing glaucoma, we want to stop damage as early in the disease as possible. For that reason, earlier diagnosis and treatment is obviously desirable, and thanks to technology such as optical coherence tomography, we can better detect structural dam-age early in the disease course, often before functional abnormalities are detectable with perimetry. This al-most certainly should result in fewer patients suffering significant vision loss as a result of glaucoma. Simultaneously, however, we must avoid making an inaccurate diagnosis of glaucoma in patients with anomalies that can be mistaken for disease.
Challenges to Early Diagnosis
One of the biggest challenges when trying to diagnose glaucoma in its earliest stages is the significant variation in the appearance of the optic disc and peripapillary region found in normal eyes. Some anomalous optic discs can be very difficult or impossible to distinguish from glaucomatous discs. Eyes with such optic discs may even have abnormal visual-field findings that can be confused with glaucomatous field defects. The same is true for the retinal nerve fiber layer and macular ganglion cell complex—anomalous structural characteristics can confound our ability to accurately distinguish between glaucomatous and normal eyes. The normative data-bases we use every day in the United States to see if our patients fall into the green, yellow or red zones are primarily composed of patients who are not highly myopic and do not have anomalous structural findings; they are “squeaky clean” normals. That’s not always a fair comparison, and it can lead one to incorrectly diagnose glaucoma.
In a patient with an anomalous optic disc, or other ocular characteristics such as high axial length, the best way to accurately establish a diagnosis of glaucoma may be to follow the patient over time, in order to look for significant structural or functional change. If a substantial loss of neural tissue is detected, and other causes have been ruled out, one can establish the diagnosis of glaucoma with a higher degree of certainty. To complicate matters further, however, there is a certain amount of loss that occurs in both neural tissue thickness and visual function simply as a result of normal aging. That means even a healthy patient will show some losses over time. The interesting twist to this is the fact that automated perimetry software inherently accounts for nor-
mal, age-related changes in visual function; however, no optical coher-ence tomography imaging platform currently makes such an adjustment.
The issue is further complicated when trying to make a diagnosis in a patient with high myopia. Myopic eyes often have a glaucomatous-looking optic disc, even in the absence of glaucoma. That’s a bit of a double-edged sword, because myopia is a risk factor for developing the disease. That means you could be looking at someone who has myopia and suspicious-looking optic nerves, and you might attribute those structural anomalies to the myopia rather than glaucoma. Of course, you might be correct, but that patient will still need to be monitored regularly because myopia is a risk factor for glaucoma. The presence of myopia simply makes it harder to make the diagnosis.
Monitoring with OCT
The reference standard for detecting progressive structural dam-age used to be comparing stereo photographs of the optic nerve taken over time. With the advent of OCT, that approach is used less frequently, in part because it’s more time-consuming than using the automated methods built into the various OCT platforms. There’s no question that it’s important to use one of these options, but I don’t believe it’s necessary to use both. If I had a choice of only one of the
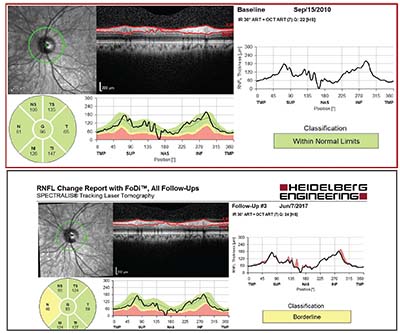 |
| This 52-year-old Caucasian man with moderate myopia had ocular hypertension with IOPs ranging from 19 to 26 mmHg. Central corneal thickness was about 560 µm OU; baseline average peripapillary RNFL thickness was 96 µm OS (top). Less than seven years later, an 11-µm decline in thickness was observed (bottom). The visual field remained normal. Imaging studies were of good quality and signal strength, with no segmentation errors, and the change was reproducible at a subsequent follow-up visit. The fairly focal nature of the change in RNFL thickness is highly characteristic of progression. |
se, I’d rather rely on OCT imaging, but others may disagree. They’d point out the one notable advantage of photographs: Unlike OCT, some argue that this technology doesn’t change over time, so you can always compare photographs. OCT technology changes periodically, sometimes making it difficult to com-pare current data to older data.
With photography, however, technology can change as well. For ex-ample, when Kodachrome film was no longer available, the color balance in photographic images changed. In addition, if exposure values differ between photographs, the cup can look larger in the image that’s relatively overexposed. Finally, progressive cataract can be more problematic for photographs than for OCT, particularly if the OCT signal strength is good—for example, 7 or higher with Zeiss’ Cirrus OCT.
When we use OCT for glaucoma diagnosis and monitoring, there are two things we usually focus on: the thickness of the peripapillary retinal nerve fiber layer and the thickness of the macular ganglion cell layer. (Different OCT platforms use different anatomical criteria for macular thickness that may or may not include the retinal nerve fiber layer and/or the inner plexiform layer, for example.) It can also be helpful to use OCT to assess the optic disc, looking at such factors as the cup-to-disc ratio; cup volume; the rim area; the rim volume; and the BMO-MRW (Bruch’s membrane opening, minimum rim width). At the moment I find assessing the optic disc with OCT less valuable than the other measurements because the measurement is not as reproducible as the RNFL and macular thickness measurements—at least using today’s technology. BMO-MRW can be very useful, however, in eyes with RNFL imaging artifacts.
What do studies teach us about the relative diagnostic ability of the different things we can measure with OCT? One study published in 2013 compared the sensitivity and specificity of different spectral-do-main-OCT measures for diagnosing preperimetric glaucoma.1 Basically, whether you’re looking at the retinal nerve fiber layer, or the vertical C/D ratio or the ganglion cell complex, the diagnostic accuracy is better for the peripapillary retinal nerve fiber layer thickness and macular ganglion cell thickness than for optic disc characteristics.
One promising possibility for detection of early disease relates to a theory that in patients with POAG, the initial site of injury to the optic nerve is at the level of the lamina cribrosa. Damage to the lamina cribrosa may cause an interruption in the axons’ axoplasmic transport, eventually leading to the loss of the axons. It’s increasingly feasible to image the lamina cribrosa with OCT, so it’s possible that ultimately, this could prove to be the best place to look for early glaucomatous damage.
Many studies have shown the utility of measuring the peripapillary RNFL thickness for diagnosing and monitoring glaucoma. One particularly strong recent prospective study demonstrated that progressive RNFL thinning determined by GPA (Guided Progression Analysis) is predictive of detectable functional decline in glaucoma.2 If you choose to use this approach, these pearls are important to keep in mind:
• Make sure that you have good, reliable baseline and follow-up images. This means that the images don’t have artifacts and were obtained with good signal strength.
• When you’re monitoring the patient over time, know how much change is significant. A ≥5-µm
change in the average retinal nerve fiber layer thickness could be important, because that amount exceeds the OCT test/retest variability. It’s also important to remember that the 95 percent confidence interval for normal age-related change in average RNFL thickness is very close to 1 µm per year.3 So if you see a change that exceeds that rate, you have strong evidence that your patient’s disease process is worsening. Additionally, a very nice study that followed normal subjects for three years showed that if the baseline average RNFL thickness is very high, the rate of normal, age-related change that occurs can be even greater than 1 µm per year.4
• If your measurements indicate that deterioration may have occurred, repeat the test to verify the progression is real. This principle also applies to visual field tests.
Alternative Testing Methods
As technology has evolved, new ways to potentially detect and confirm the diagnosis of glaucoma in its earliest stages have appeared, and some of them show promise. In terms of functional testing to detect glaucoma, there is strong evidence that 10-2 visual fields can sometimes detect abnormalities in glaucoma earlier than standard 24-2 or 30-2 visual fields. The same is true for frequency doubling technology. However, most of us have abandoned short-wave-length automated perimetry because of its poor specificity.
There are also a number of electro-physiological testing strategies that can be used to diagnose glaucoma, such as pattern electroretinography (ERG). Vittorio Porciatti, DSc, at Bascom Palmer, was an early investigator in the use of pattern ERG to detect glaucoma. His group showed that many eyes with ocular hypertension show improvement in pattern ERG amplitudes when their intraocular pressure is lowered. There’s a prevailing, widely accepted belief that structural damage occurs before functional damage in glaucoma, but these results suggest that this may depend on how you’re looking at structural and functional damage. They also raise the possibility that other approaches to looking at function, such as pattern ERG, might actually be superior to visual field testing, although in my opinion this is still investigational.
A relatively new approach to de-tecting early glaucoma that’s showing promise is OCT angiography. This technology rapidly scans the same tissue area multiple times and analyzes changes in the tissues, thus revealing the presence of blood vessels and the amount of blood flow. There is some early evidence that the reduction in blood flow detectable with this technology is predictive of RNFL thinning. For example, a 2017 study demonstrated that vessel density attenuation in both affected and intact hemiretinas was associated with the extent of visual field damage in the corresponding hemifields.5
Using All the Information
Of course, a clinician might well ask whether pushing the envelope on being able to detect glaucoma earlier truly benefits patients. In reality, glaucoma is usually a slow disease process. There’s no overwhelming, convincing evidence that you’re on a slippery slope once the disease has progressed a very small amount. So going to heroic lengths to conduct tests that might reveal very early disease is arguably not necessary.
Obviously it’s useful to be attentive when monitoring patients who are glaucoma suspects, and it makes sense to try to get a diagnosis while the disease is still at an early stage. In some cases you may find an early visual field defect that matches a defect in the nerve fiber layer that’s visible on OCT, for example, so it’s possible to detect glaucoma early without going to unusual lengths. For the time being, I don’t believe that excessive and repetitive testing—especially testing that’s still on the boundaries of what is proven to be useful, such as pattern ERG—has any utility outside of research. However, I do believe strongly that standard perimetry and OCT imaging of the macula and peripapillary RNFL on an annual basis is important.
When it comes to making a diagnosis of early glaucoma and deciding whether to initiate treatment, these strategies are worth keeping in mind:
• Use all of the data that are available to you. This should certainly include information about the optic disc appearance, the visual field test results and imaging data.
• Know what to look for. Different patterns of damage can result from glaucoma. When following a patient over time, focal damage—in which an area of the visual field, or the retinal nerve fiber layer or the ganglion cell complex is distinctly damaged compared to surrounding tissue—is generally easier to detect than diffuse damage, such as when the entire nerve fiber layer has thinned.
• Take into account the quality of the data you’ve captured. In particular, be on the lookout for measurement artifacts associated with the technology you’re using.
• When you see a change or a new abnormality, repeat the test to verify that the findings are ac-curate. Given test-retest variability, avoid drawing conclusions based on a single test result without confirming that result first.
• Take into account other im-portant risk factors that are as-
sociated with glaucoma. If the patient has a suspicious retinal nerve fiber layer and an optic disc hemorrhage, that definitely increases the likelihood that the patient has glaucoma.
• Take family history into account. In the Ocular Hypertension Treatment Study, family history was not identified as risk factor for conversion to glaucoma; however, most of us believe that this was because the patients’ histories may not have been ascertained accurately in the study.
• Take the patient’s age and general health into account. This could be relevant in terms of decid-ing how important it is to diagnose glaucoma very early, and even whe-ther to initiate treatment.
Doing What We Can
There’s no question that there’s an advantage to detecting glaucoma early. Unfortunately, the earlier you try to detect glaucoma, the more sensitive your testing algorithm has to be, and the more testing you have to do. In general, when trying to diagnose glaucoma early using the diagnostic methodologies available to us today, higher sensitivity of the diagnostic algorithm comes at the cost of lower specificity. In other words, the earlier we try to establish the diagnosis of glaucoma, the higher the likelihood that we’ll arrive at that diagnosis incorrectly. So the real question is, how early do we need to detect glaucoma, and to what degree should we compromise specificity in order to accomplish that? Since glaucoma is usually slowly progressive, we usually have the luxury of time; if we monitor our glaucoma suspect patients on an annual or semiannual basis, it’s very unlikely that patients with early disease will progress in a fashion that results in noticeable visual impairment. There’s little risk in waiting until you’re sure.
I think it’s important to explain this to patients who are being monitored as glaucoma suspects. We can tell them that at this point in time it’s not possible to be certain about their diagnosis. However, we can also reassure them that the disease generally progresses slowly. I tell patients that with careful monitoring we will be able to detect any significant changes early because of all of the advanced testing we’re able to do. And as soon as we do detect concrete evidence of a problem—if we ever do—we can initiate therapy. I think that’s an important message to be able to give patients. REVIEW
Dr. Tanna is an associate professor of ophthalmology, director of glaucoma and vice chair of the Department of Ophthalmology at the Feinberg School of Medicine at Northwestern University in Chicago.
1. Lisboa R, Paranhos A Jr, Weinreb RN, et al. Comparison of different spectral domain OCT scanning protocols for diagnosing preperimetric glaucoma. Invest Ophthalmol Vis Sci 2013;13:54:5:3417-25.
2. Yu M, Lin C, Weinreb RN, et al. Risk of visual field progression in glaucoma patients with progressive retinal nerve fiber layer thinning: a 5-year prospective study. Ophthalmology 2016;123:6:1201-10.
3. Leung CK, Ye C, Weinreb RN, Yu M, Lai G, Lam DS. Impact of age-related change of retinal nerve fiber layer and macular thicknesses on evaluation of glaucoma progression. Ophthalmology 2013;120:12:2485-92.
4. Leung CK, Yu M, Weinreb RN, Ye C, Liu S, Lai G, Lam DS.
Retinal nerve fiber layer imaging with spectral-domain optical coherence tomography: a prospective analysis of age-related loss. Ophthalmology 2012;119:4:731-7.
5. Yarmohammadi A, Zangwill LM, Diniz-Filho A, et al. Peripapillary and macular vessel density in patients with glaucoma and single-hemifield visual field defect. Ophthalmology 2017;124:5:709-719.