Amitha Domalpolly, MD, and Ronald P. Danis, MD, Madison, Wis.
Since its commercialization in 1995, optical coherence tomography has become a nearly indispensable imaging and measurement tool for the diagnosis and management of macular disease. This article will briefly review practical considerations for improving results with the widely used time-domain OCT.
Background
While spectral or Fourier-domain OCT has received a great deal of attention due to its recent commercial introduction, time-domain OCT with the Zeiss Stratus instrument remains the most common type due to its very high market penetration. The OCT 3 (Stratus OCT3, Zeiss Meditec) is relatively easy to administer, especially compared to fluorescein angiography and fundus photography. The time-efficient or fast macular scans allow rapid acquisition of six low resolution (128 A scans per radial line) radial scans in 1.92 seconds. The scan length can be adjusted from 3.5 to 6 mm. The software-generated retinal thickness map analysis report (See Figure 1) includes: a) a sample B-scan image (truncated display of the scan with lowest signal strength); b) a greyscale fundus image, which should depict the location of the radial scans; c) a nine subfield grid (similar to the ETDRS macular grid used to grade fundus photographs) presented as a numeric plot; d) a pseudocolor retinal thickness map and; e) the mean center point thickness (obtained at the center point of the grid) with a standard deviation.
The area of the 6-mm diameter grid from the Stratus OCT is 44-percent smaller than the standard grid used for grading fundus photographs, which has a diameter of 7.2 mm (See Figure 2).
Variables such as signal strength and the analysis confidence message are available on the report to give the operator objective feedback on the image quality and the instrument's assessment of the reliability of the segmentation algorithm. This algorithm analyzes individual B scans to identify the layers likely to represent the internal limiting membrane and the retinal pigment epithelium layers by location and tissue density. The data produced by the instrument when there is low signal strength or low analysis confidence may be correct, but due to signal quality the risk of artifact is high and the thickness data requires scrutiny.
The numeric data generated by the Stratus software is utilized in clinical research for determining eligibility of a patient for clinical trials, therapeutic outcome and longitudinal follow-up. Retinal thickness measurements can be obtained for the entire scanned area as mean retinal thickness in each of the grid subfields of the numeric plot or displayed as thickness chart in the retinal thickness report (See Figure 3), or shown as total macular volume (the mean retinal thickness over the entire grid multiplied by the area). The reproducibility of the grid plot has been measured to be good in both normal1 and diseased maculas.2 The technician, clinician and researchers should, however, be aware of potential artifacts when scanning the macula, some of which are operator-dependent and avoidable, and may significantly affect the quality and reliability of OCT3 data. The problems most commonly identified among OCT scans submitted to the
Boundary Line Errors
Boundary line (BL) errors are the most common artifact affecting OCT quality: Up to 60 percent of scans with poor quality issues have boundary line errors. The segmentation algorithm may fail to correctly identify the ILM or RPE layers for a variety of reasons. 
Abnormal morphology may incorrectly identify the ILM or RPE, particularly when the anatomy is highly distorted. Dense vitreous membranes may be identified as the inner retinal layer. An attenuated inner retina overlying a large cyst may be disregarded and the inner boundary may dip into outer retinal layer. The disorganized anatomy associated with choroidal neovascular membranes is a significant pitfall of the identification of the outer boundary. In normal eyes, the segmentation algorithm incorrectly identifies the IS-OS junction as the outer boundary line.3,4 This means that in normal eyes, the calculated retinal thickness is about 34 µm thinner than actual at the macular center.4 In eyes with pathology, the IS-OS boundary is frequently disrupted and the software may unintentionally identify the true RPE layer as the outer boundary. This disparity between boundary line localization in some eyes should be remembered by clinicians when making use of the retinal thickness measurements.
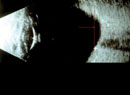
When the signal strength is low, poor image quality compounds the difficulty of segmentation of tissue layers and makes BL errors particularly common. The desired signal strength of an OCT image is greater than 5.5. Causes of low signal strength include small pupil size, edge artifact from not having the scan image centered in the pupil, severe cataract, and vitreous hemorrhage. In extreme cases, degraded images are produced from which no data can be retrieved (See Figure 4). If the underlying cause can be rectified, such as improving pupillary dilation and focusing the scan area through the center of the pupil, rescanning can improve the image. 
The orientation of the scan sampling area to the retina in the anterior-posterior (Z) axis can be erroneous which also leads to BL errors (See Figure 5). The Z-offset fine-tuning of the instrument allows adjustment of the scan depth to accommodate orbital configuration differences or high ocular axial length. When the area of the scan falls too far forward or behind the retina, this is called Z offset error. This often occurs if the patient's forehead is moving backward away from the headrest during the scan.
The best way for an operator to identify BL errors is to evaluate the underlying radial scans from the retinal thickness report. Additional clues include bow tie or wedge-shaped artifacts seen in the pseuodocolor map (See Figure 6) and a large standard deviation. If the centerpoint is affected by the BL error, manual remeasurement can be performed using the software's electronic calipers.
Decentration Artifact
The fast macular scan comprises six individual radial scans intersecting at a point. Decentration occurs when the intersecting point is not located on the anatomic fovea. This could be from operator placement error due to difficulty in localizing the fovea or due to fixation problems such as eccentric fixation, poor fixation or the patient's eye movements. About 15 percent of poor quality OCTs have decentration artifact. Though less frequent than boundary line errors, decentration artifacts affect the data much more adversely. Since the grid is not centered on the macula, the entire numeric plot including the centerpoint thickness and the subfield values in decentered scans are considered erroneous. The macular thickness algorithm identifies the inner and outer retinal boundary lines and calculates the linear distance between the two lines at the centerpoint of each of the six scans (i.e., A scan 64) as shown in Figure 7. It then derives a mean of the six individual thickness values along with a standard deviation. Thus, centerpoint thickness merely represents the mean thickness of all six scans at A scan 64. Whether this represents the foveal center is for the clinician to interpret.
In other words, centration of the scan is essential for the centerpoint thickness to be interpreted as foveal thickness. The centerpoint thickness is the most used parameter at reading centers because it can easily be reclaimed with the caliper measurements if centration is incorrect.
Each of the elements of the retinal map report can provide clues regarding the centration of the scan. The greyscale image can help in localizing the scan area; the horizontal (9-3) scan line should be placed one-quarter of the way up from the bottom of the disc. The pitfall to this method is that fundus images are taken after the scan is completed, and so this may not be a true indicator. In addition, the greyscale image often has poor contrast, which makes identification of the anatomic landmarks and the scan lines problematic. The pseudocolor map can sometimes indicate the location of the fovea, especially for maculas with a recognizable foveal depression.
The severity of decentration can be assessed using individual B scans (See Figure 8). The morphological center of the macula should be at A scan 64. One A scan covers a lateral dimension of about 47 µm, which means a displacement of 10 A scans puts the fovea near the edge of the border of the central subfield of the grid (the central subfield has a 1-mm diameter).
In situations where there is no recognizable fovea, such as with edema, alternative clues are used to localize the center of the macula on individual B-scan images: a) attenuation and disappearance of the ganglion cell layer and nerve fiber layer on either side of the fovea; b) in eyes with cystoid edema, the largest cysts are assumed to locate the center; and c) if available, high-resolution scans could be cross-referenced along with the corresponding clockhour radial scans. In thick retinas with distorted foveal architecture, where none of these clues can be translated, a "centered unless otherwise proven" policy is used at the reading center.
The standard deviation of the centerpoint thickness is a measure of the scan variance. A high standard deviation (>10 percent of centerpoint thickness) indicates high variability, usually due to patient movement or boundary line error, and therefore incorrect centerpoint thickness. A low SD (<10 percent), however, does not have a predictive value. Substantially decentered scans could have a low standard deviation.
In the clinic setting, there are two ways to deal with decentration. One would be to realign and retake the image. The second would be to identify the center of the macula in at least one of the six B scans and manually place the software calipers to remeasure the foveal thickness. This issue could be avoided with the spectral domain OCTs since identification of the fovea is done post hoc and with reference to the color fundus image.
OCTs in Clinical Research
The 
About 30 percent of OCT submissions to the reading center require manual remeasurement. The operator's knowledge of identification of artifacts could play an important role in improving the quality of OCTs and reduce the frequency of manual remeasurement. Good quality OCTs in clinical research would result in more useful data. In clinical practice OCTs are used more for their morphological evaluation as against numeric output. An OCT may have erroneous centerpoint thickness but still be suitable for morphological evaluation. When numeric data is used, quality assessment plays an equally important role in clinical practice also.
Quality assessment of an OCT scan is important to avoid erroneous interpretation of the software generated data. The retinal map analysis report should be carefully scanned for artifacts: 1) BL errors can be identified on the OCT image and pseudocolor map (seen as wedge or bow-tie artifacts); a high standard deviation would indicate incorrect centerpoint thickness; 2) decentration can be identified on the fundus image and pseudocolor map. Low signal strength, low confidence analysis message by the software and standard deviation >10 percent would further indicate presence of artifacts. Finally, it is always advisable to evaluate the report alongside examination of the underlying radial scan images.
Dr. Domalpally is co-director of the
1. Paunescu LA, Schuman JS, Price LL, et al. Reproducibility of nerve fiber thickness, macular thickness, and optic nerve head measurements using Stratus OCT. Invest Ophthalmol
2. Polito A, Del Borrello M, Isola M, Zemella N, Bandello F. Repeatability and reproducibility of fast macular thickness mapping with Stratus optical coherence tomography. Arch Ophthalmol 2005;123:1330-7.
3. Costa RA, Calucci D, Skaf M, et al. Optical coherence tomography 3: Automatic delineation of the outer neural retinal boundary and its influence on retinal thickness measurements. Invest Ophthalmol Vis Sci 2004;45:2399-406.
4. Pons ME, Garcia-Valenzuela E. Redefining the limit of the outer retina in optical coherence tomography scans. Ophthalmology 2005;112:1079-85.
5. Sadda SR, Wu Z, Walsh AC, et al. Errors in retinal thickness measurements obtained by optical coherence tomography. Ophthalmology 2006;113:285-93.
6. Diabetic Retinopathy Clinical Research Network. Diurnal variation in retinal thickening measurement by optical coherence tomography in center-involved diabetic macular edema. Arch Ophthalmol 2006;124:1701-7.