Like any test, visual field tests can contain artifacts. The test subject is a human being, prone to being imperfect and influenced by external factors, and the same is true of the person administering the test. So, when we’re reviewing field results in an attempt to determine a patient’s condition, and whether or not progression has occurred, we have to expect variability and artifacts.
Most of us are aware of the issue of artifacts, and we know the patterns of many of them. However, that can make it easier for us to misinterpret a field; we feel comfortable that if there’s an issue, we’ll notice it. But in the clinic, seeing a host of patients on a busy day, we may be looking through visual fields quickly while simultaneously fielding patient questions, and not always looking carefully at the indices and other details—details that might alert us that something isn’t what it appears to be.
It’s true that some nonglaucomatous problems produce a pattern that’s recognizable as something other than glaucoma. On the other hand, some diseases—as well as some types of human error—can produce test results that do resemble glaucoma, giving the appearance of a glaucomatous scotoma. It’s important that we remain vigilant for artifacts and errors.
Here, I’ll present a number of visual fields in which something is amiss, and then explain what produced the artifact. See if you can identify the nature of the artifact and its cause before reading the explanation.
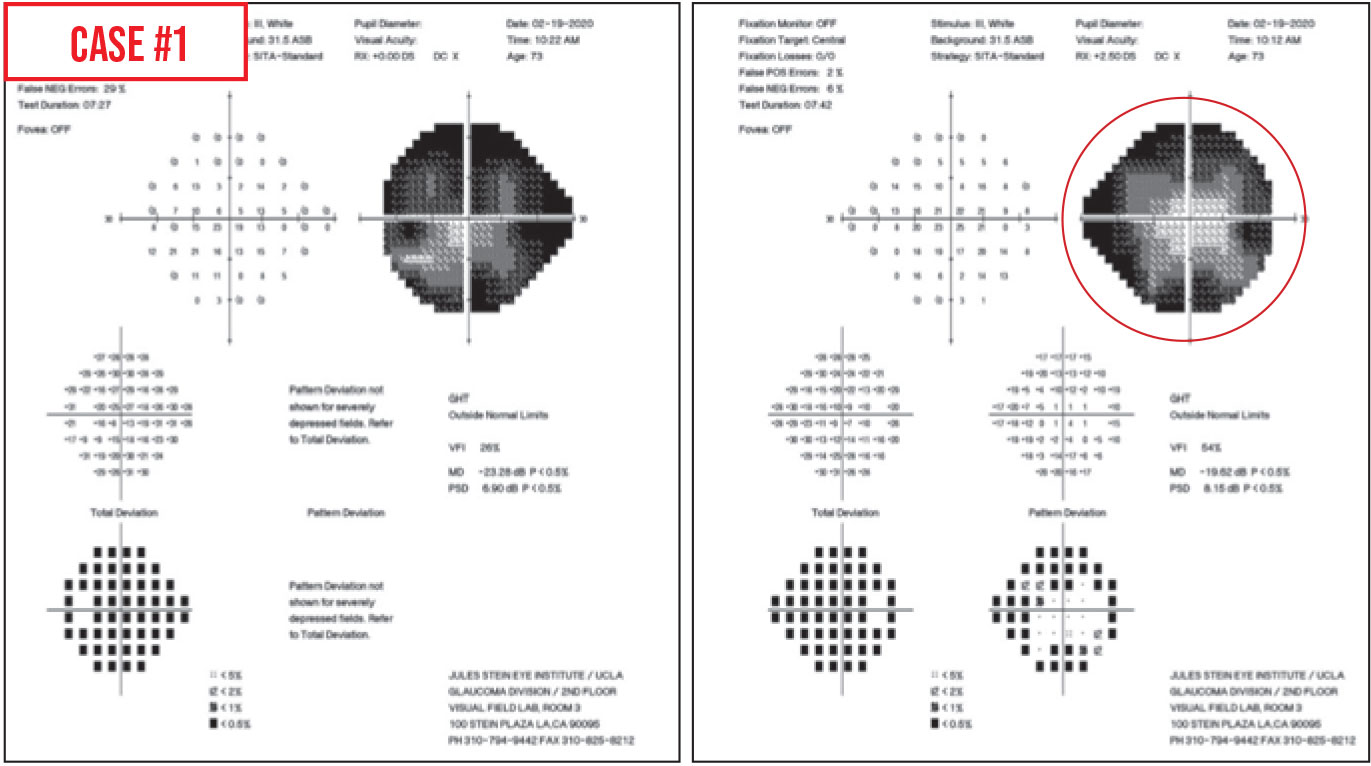 |
Case 1. At first glance, the visual field defects look like dense arcuate scotomas. However, the central points in each quadrant are much lighter than the surrounding points. This is a classic “cloverleaf” pattern (see circled area)—a type of false negative result. The reason this occurs is that the testing algorithm always starts in the center of each quadrant; that’s where it does a threshold test, even if you’re using the SITA standard strategy. Test points spiral out from those central quadrant testing points.
Why would this lead to false-negative responses? Usually, while the first four spots are tested, the technician is hovering over the patient and the patient does a good job. Once the technician walks away, perhaps to start another patient on a visual field test, the patient can lose interest in the test and stop responding. That’s why you get this four-leaf-clover pattern.
This type of artifact is fairly common; in a busy clinic I expect you’ll see it at least a couple of times a month. Some patients may repeat this pattern over and over again, either because they don't understand the test, they’re lulled to sleep during the test, they have early dementia or they simply don’t like taking the test. This pattern can be seen in patients with advanced glaucoma, in which case it can be difficult to know the true status of the peripheral vision. It can also be seen in those with milder glaucoma, in which case an examination of the optic nerve will help one realize that the test was faulty, because the optic nerve would look much healthier than a nerve consistent with such a poor visual field.
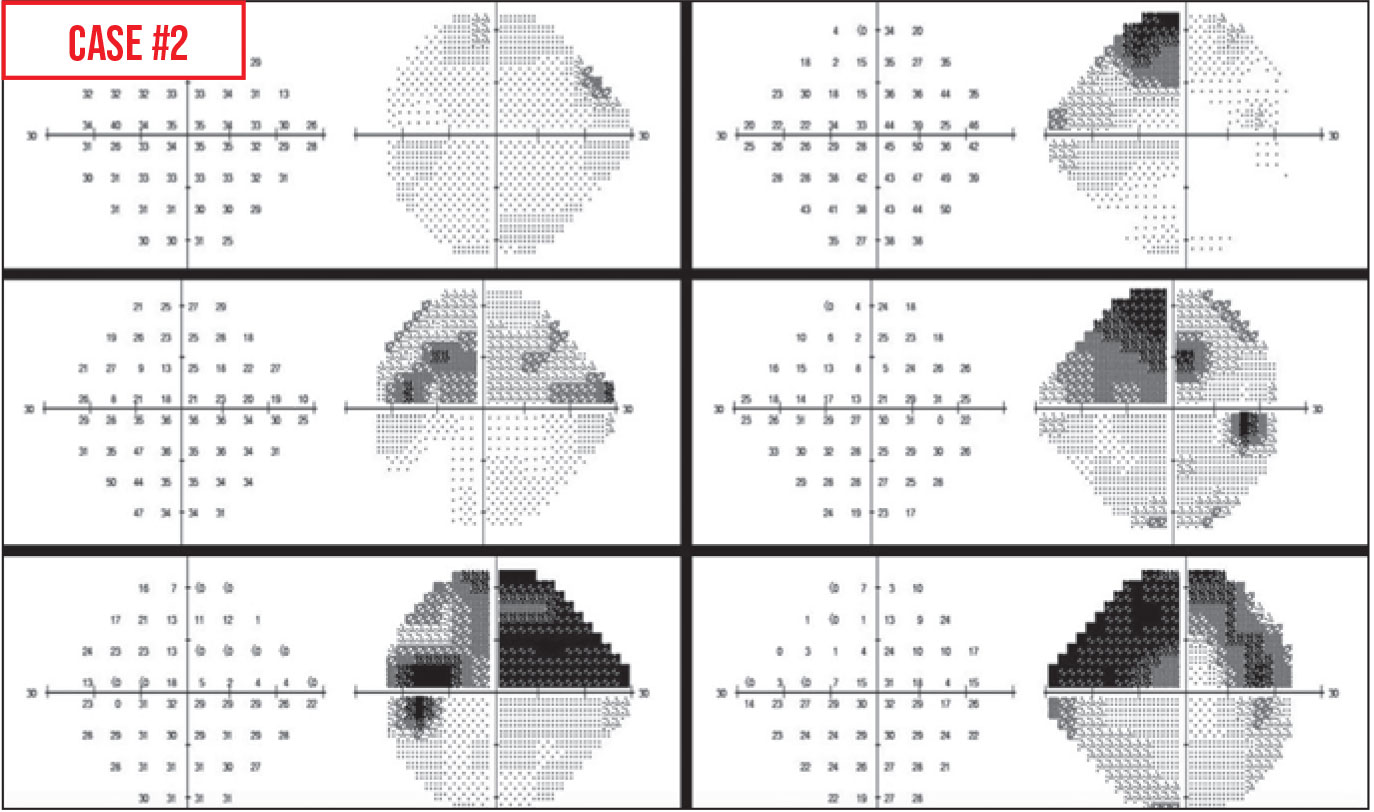 |
Case 2. Here, the total deviation plot is normal but the pattern deviation plot shows an inferior depression. This should jump out at you as unusual, because normally the total deviation plot shows some depression if the pattern deviation plot is abnormal (except in some rare circumstances among younger patients). If the total deviation plot is normal and the pattern deviation plot isn’t, something is likely amiss.
Another clue that something is unusual is that the mean deviation in a normal patient is usually no higher than +2 dB. Here, it’s reading +2.31 dB. Other signs include that the false-positive index is a little high, and the blind spot isn’t as dark as you’d expect it to be. Furthermore, the glaucoma hemifield test is flagging that there’s abnormally high sensitivity.
All of these factors point to a high rate of false positives, meaning that the patient is trigger-happy. The patient is responding to every test point—even if he or she can’t see it. The absolute sensitivities at many points will be much higher than expected for the patient's age (normal sensitivity would be around 30 to 32 dB). In addition, if there are test points that the patient actually did see at the expected decibel level and responded to accurately, those normal points will end up looking abnormally low because all of the surrounding test point sensitivities are so abnormally high.
The reason the pattern deviation isn’t normal while the total deviation is, is that pattern deviation is usually calculated based on the total deviation plot values. The software finds the seventh most sensitive non-edge point on the total deviation plot, and then resets that value to zero. Then, it adds or subtracts that amount of change from all the other spots. For example, if the seventh most sensitive spot was +7 dB, and you convert that to zero, then all the other test points get 7 subtracted from them. Mathematically, points with the expected normal sensitivities will look depressed in comparison to all the other superhumanly sensitive test points because of the patient’s high rate of false positives.
Why might a patient produce this kind of test result? This happened with one of my patients who had severe glaucoma and obvious arcuate scotomas on her first visual field; she later became a “bad” test taker. Subsequent visual field tests looked a lot better, with less dense or no scotomas (see Figure). I believe she was nervous about losing her vision and knew how much weight I placed on visual field results, and she wanted her results to look better than they were to avoid further surgery.
Certainly, if visual fields start looking better in a patient that you know has severe glaucoma and defects, you should suspect that the cause is a high rate of false positives. (These tests should be ignored when you’re looking at progression. They’re very unreliable.)
 |
Case 3. This field is from a patient’s left eye. There’s a superior defect, particularly prominent on the total deviation and pattern deviation plots, that look arcuate.
In this case, the defect was caused by severe dermatochalasis obstructing peripheral vision. However, it could also have been the result of a trial lens rim blocking vision. The patient’s chin can slip off-center in the chinrest; the head becomes tilted a bit and the patient is looking upwards with a chin-down position. Then, the superior test point lights could be blocked by the trial lens.
One of the clues that the projected lights are being blocked from view is an absolute sensitivity score less than zero. Zero means that the machine is projecting a light to the patient with no filter dimming the intensity, so it’s the brightest light the machine can project. If the sensitivity is <0, that means the patient couldn’t see that brightest light. If test points adjacent to those <0 points are close to normal sensitivity, the <0 dB probably indicates that something was blocking the light, preventing the patient from seeing it.
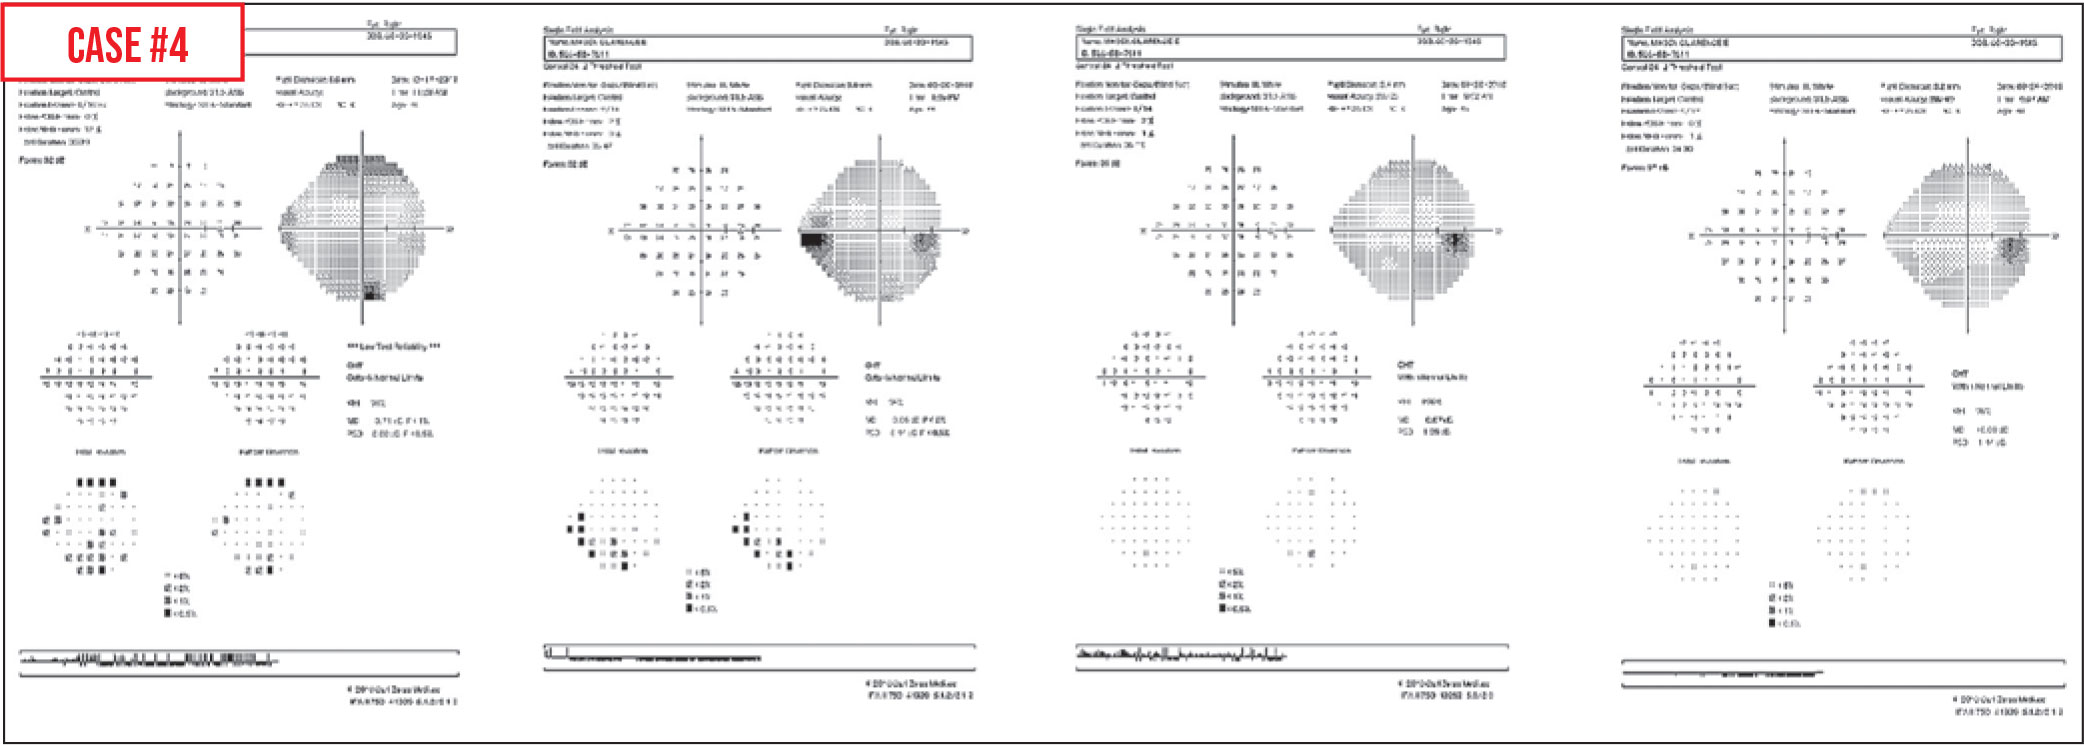 |
Case 4. Here’s a series of visual fields from a glaucoma suspect I’ve been following. The first field in 2017 showed some defects around the periphery. We repeated the visual field about four months later; that field showed an inferior nasal step that looks glaucomatous. However, when tested again six months later, the inferior nasal step had disappeared. Furthermore, a year later the visual field looked normal again. Meanwhile, the nerve consistently looked normal on examination, as did the retinal nerve fiber layer on OCT.
This is an example of a patient with a significant learning curve. For some patients, it takes a few visual field tests to figure out what’s required of them. This is why whenever there’s an abnormality—especially the first time patients are tested—you want to repeat it to confirm the result.
Learning-curve errors can last through seven or eight visual fields for some patients. Many patients are anxious when they’re first doing these tests, and they may not fully hear the instructions; they’re worried about going blind. They may also be physically uncomfortable after the first few minutes and shift in the seat or in the chinrest. All kinds of issues can result in an abnormal test, especially when the patient is new to the experience.
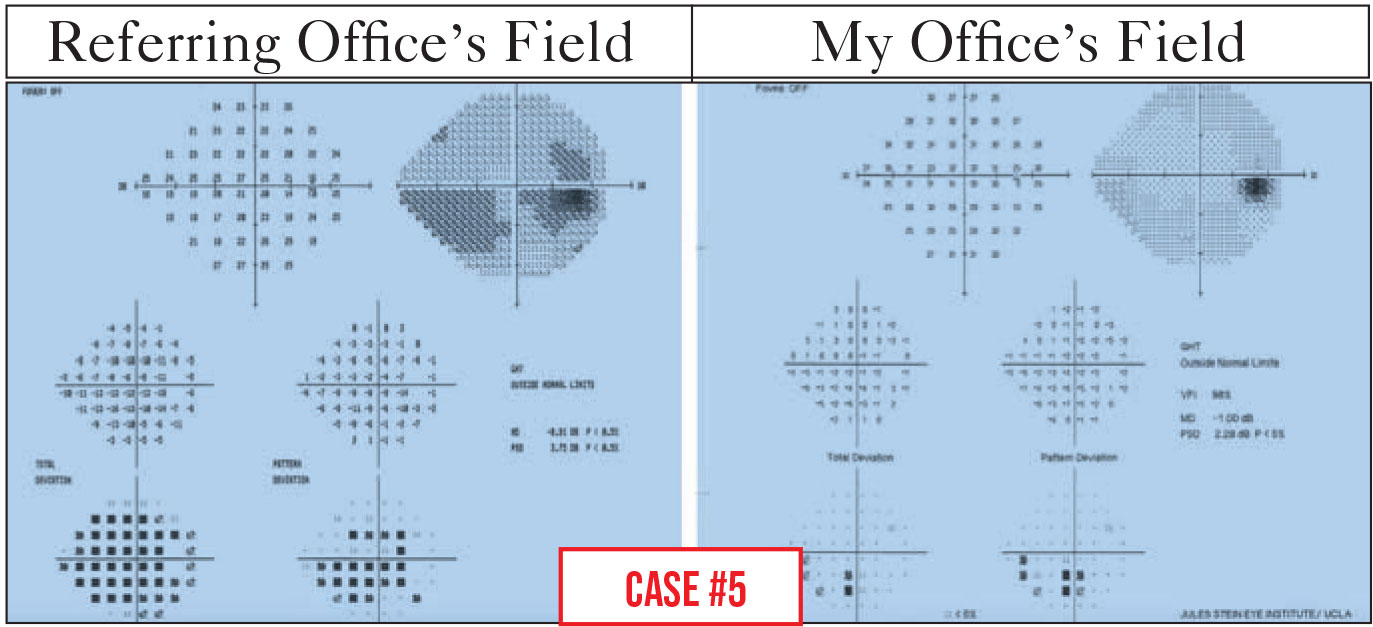 |
Case 5. This patient was sent to me for a possible trabeculectomy because of progression seen on her visual fields. While the patient and I were talking about visual field testing in general, she expressed to me how difficult it had been to see the test lights during her last test. She didn’t believe the changes shown by the test were real.
Because she didn’t believe the results, we decided to do another visual field in my office, and there was a big difference in the result. In the visual field done at the referring office, the total deviation plot was very depressed generally, and there was an inferior arc, as well as possible superior changes. In my office the total deviation plot was much better, and the mean deviation went from -8.91 dB to -1 dB. That’s a huge improvement. In fact, it was clear that her inferior arc scotoma, seen in earlier testing, hadn't progressed.
As the patient and I talked, it became clear that the technician in the referring office didn’t use a trial frame with the patient’s refractive correction. Since she wasn’t wearing her contact lenses, she took the test blurred. For each diopter of blur, one expects a depression of 1 dB in the visual field. If the lights aren’t in sharp focus, the patient isn’t going to do very well on the test.
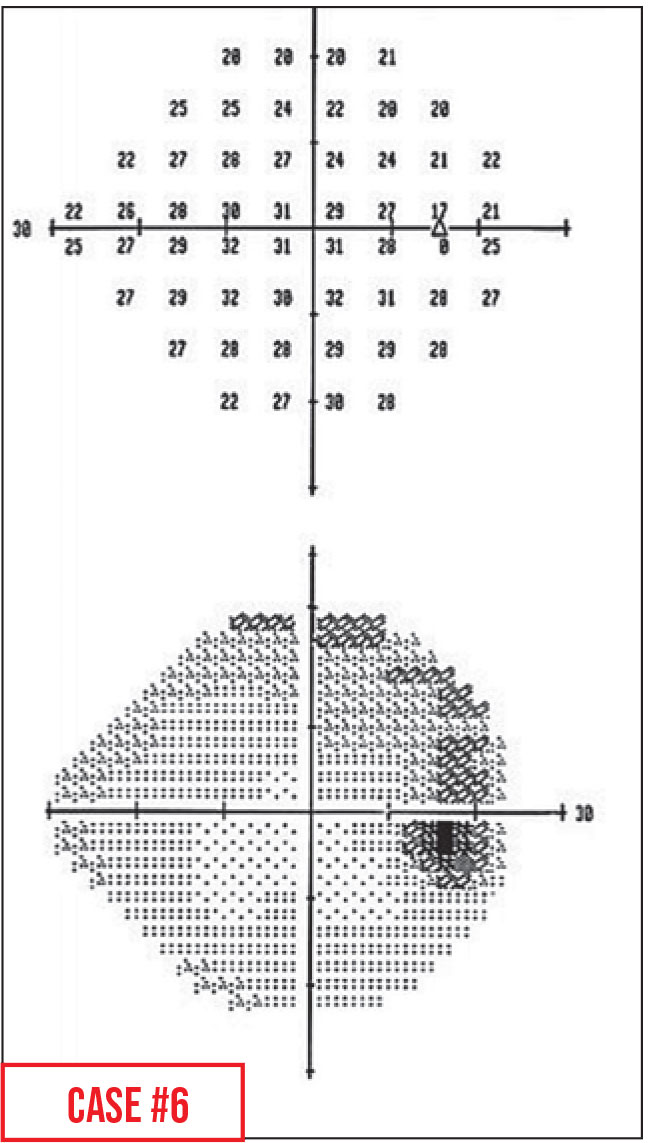 |
Case 6. This patient is a high myope, with what looks like a superior arcuate scotoma. However, the physical exam suggested another explanation: The optic disc was a little bit tilted.
This artifact is called a refraction scotoma, or tilted-disc-syndrome scotoma. Because the disc is tilted, even when the eye is refracted correctly the tilt causes a part of the retina to be farther away from the point of best focus. As a result, the trial frame brings light into focus anterior to the retina that tilts posteriorly with the nerve, and the test lights in those locations are blurred on the retina. This can cause the appearance of a shallow scotoma in that area.
Typically this area will be superior, because most nerves are tilted inferiorly; however, some myopic nerves are tilted in other directions, causing the scotoma to appear elsewhere. This example is a typical one—the apparent defect is superior and comes off of the nerve.
As noted, this explanation for the apparent scotoma can be confirmed by your physical examination of the nerve. If you have time, you could retest, providing more minus correction, which should make the relative scotoma disappear. (Of course, most busy offices don’t have time for this repeat testing.)
This artifact is relatively common. In a busy clinic, a doctor could encounter this weekly.
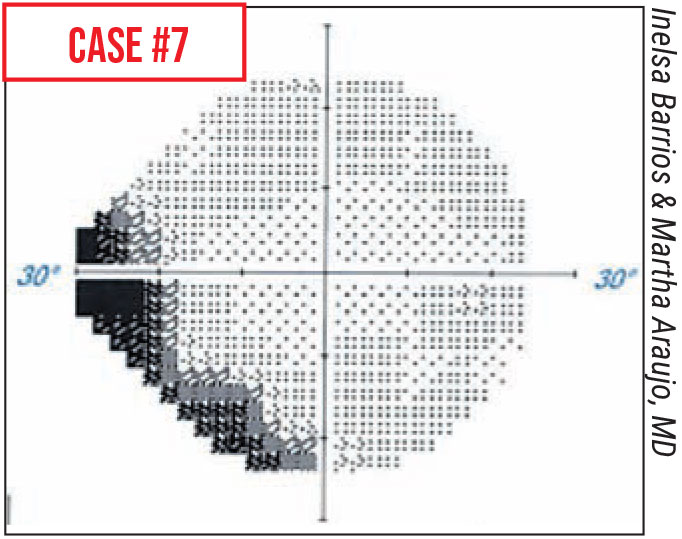 |
Case 7. In this patient the visual field revealed what appeared to be a superior nasal step scotoma. However, a few minutes later the test was repeated, and the defect disappeared. This is a defect many ophthalmologists began noticing in 2020, when patients started wearing masks because of COVID-19. The scotoma went away when the mask was taped down. A related defect observed in the past year was an illusion of worsening scotomas caused when trial frame lenses fogged up with mask use. Again, taping down the superior edge of the mask to prevent the patient's breath moving upwards solves the problem.
A similar defect may be caused by a prominent nasal bridge that blocks the patient’s view of nasal test points. Sometimes just turning the patient’s head a few degrees towards the nose can get the nose out of the field of view and eliminate the defect.
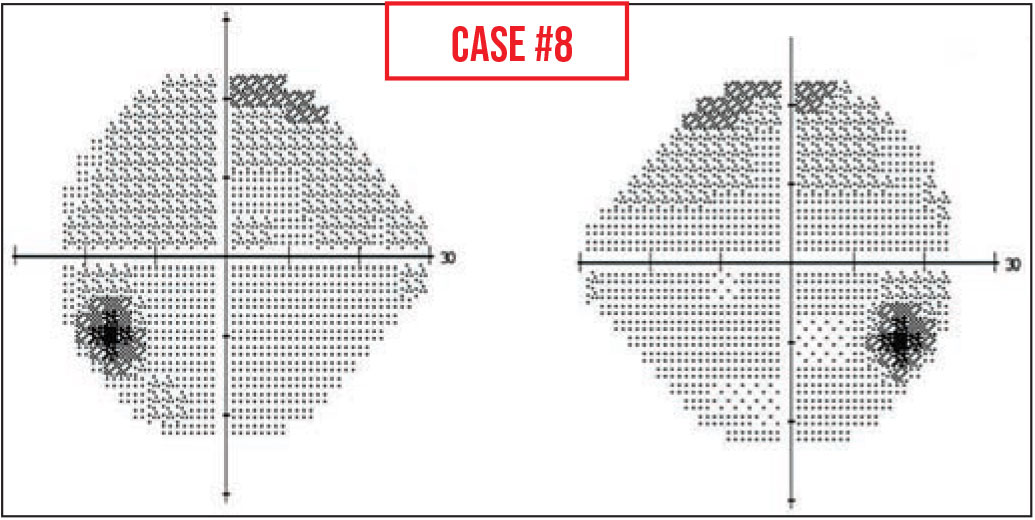 |
Case 8. In this visual field the blind spot is much lower than we’d expect it to be. Normally the blind spot is right at the horizontal meridian; here, it’s a number of degrees below that.
This can happen because the patient fixates on the marks for foveal threshold testing, which are on the perimeter bowl below the central fixation light, or because they aren't told to change fixation after foveal threshold testing. If their fixation is below the central target, then their entire visual field will be lower than expected, including the blind spots.
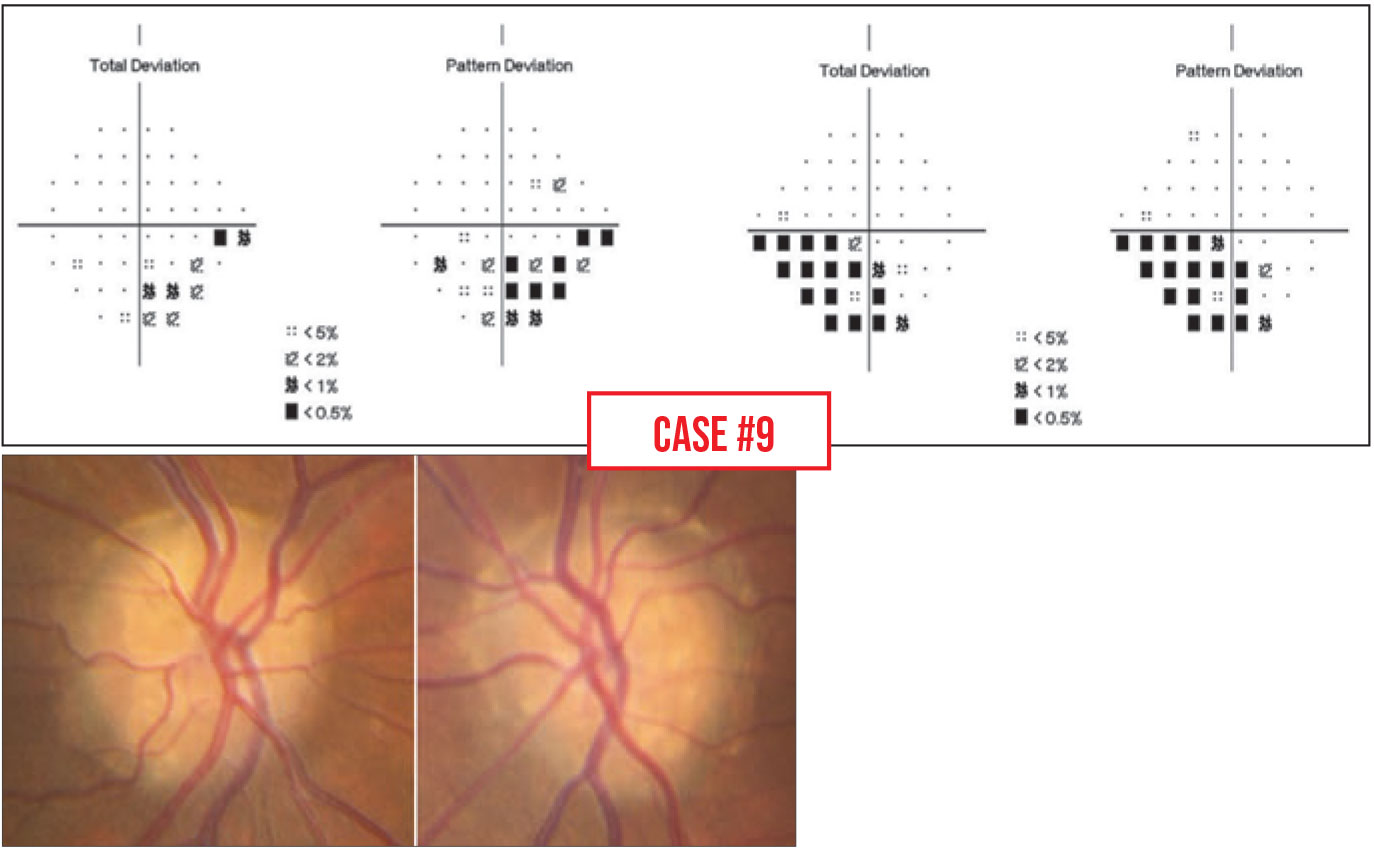 |
Case 9. In this patient’s field, the defect looks glaucomatous. However, a quick look at the nerve reveals that the defect is being caused by drusen.
What’s interesting is that in some eyes, the drusen are buried under the surface where you can’t see them on a physical exam; in these patients the optic nerve tends to look normal, with no cupping, but there will still be nerve fiber bundle defects resembling glaucoma on OCT imaging. You can check this further by performing an OCT of the optic nerve head, where drusen will appear as hypoechoic black areas, or by using ultrasound. The drusen are usually calcified, so on ultrasound you’ll see bright spots at the optic nerve head.
Unfortunately, we don’t have any treatment for removing optic nerve head drusen. Visual field defects from drusen are treated the same way scotomas due to glaucoma are treated; the rationale is, if you reduce the IOP you’re taking pressure off the nerve that’s getting squeezed from the other side by these drusen. So, if the hidden drusen lead to a misdiagnosis of glaucoma, the patient may get the same treatment.
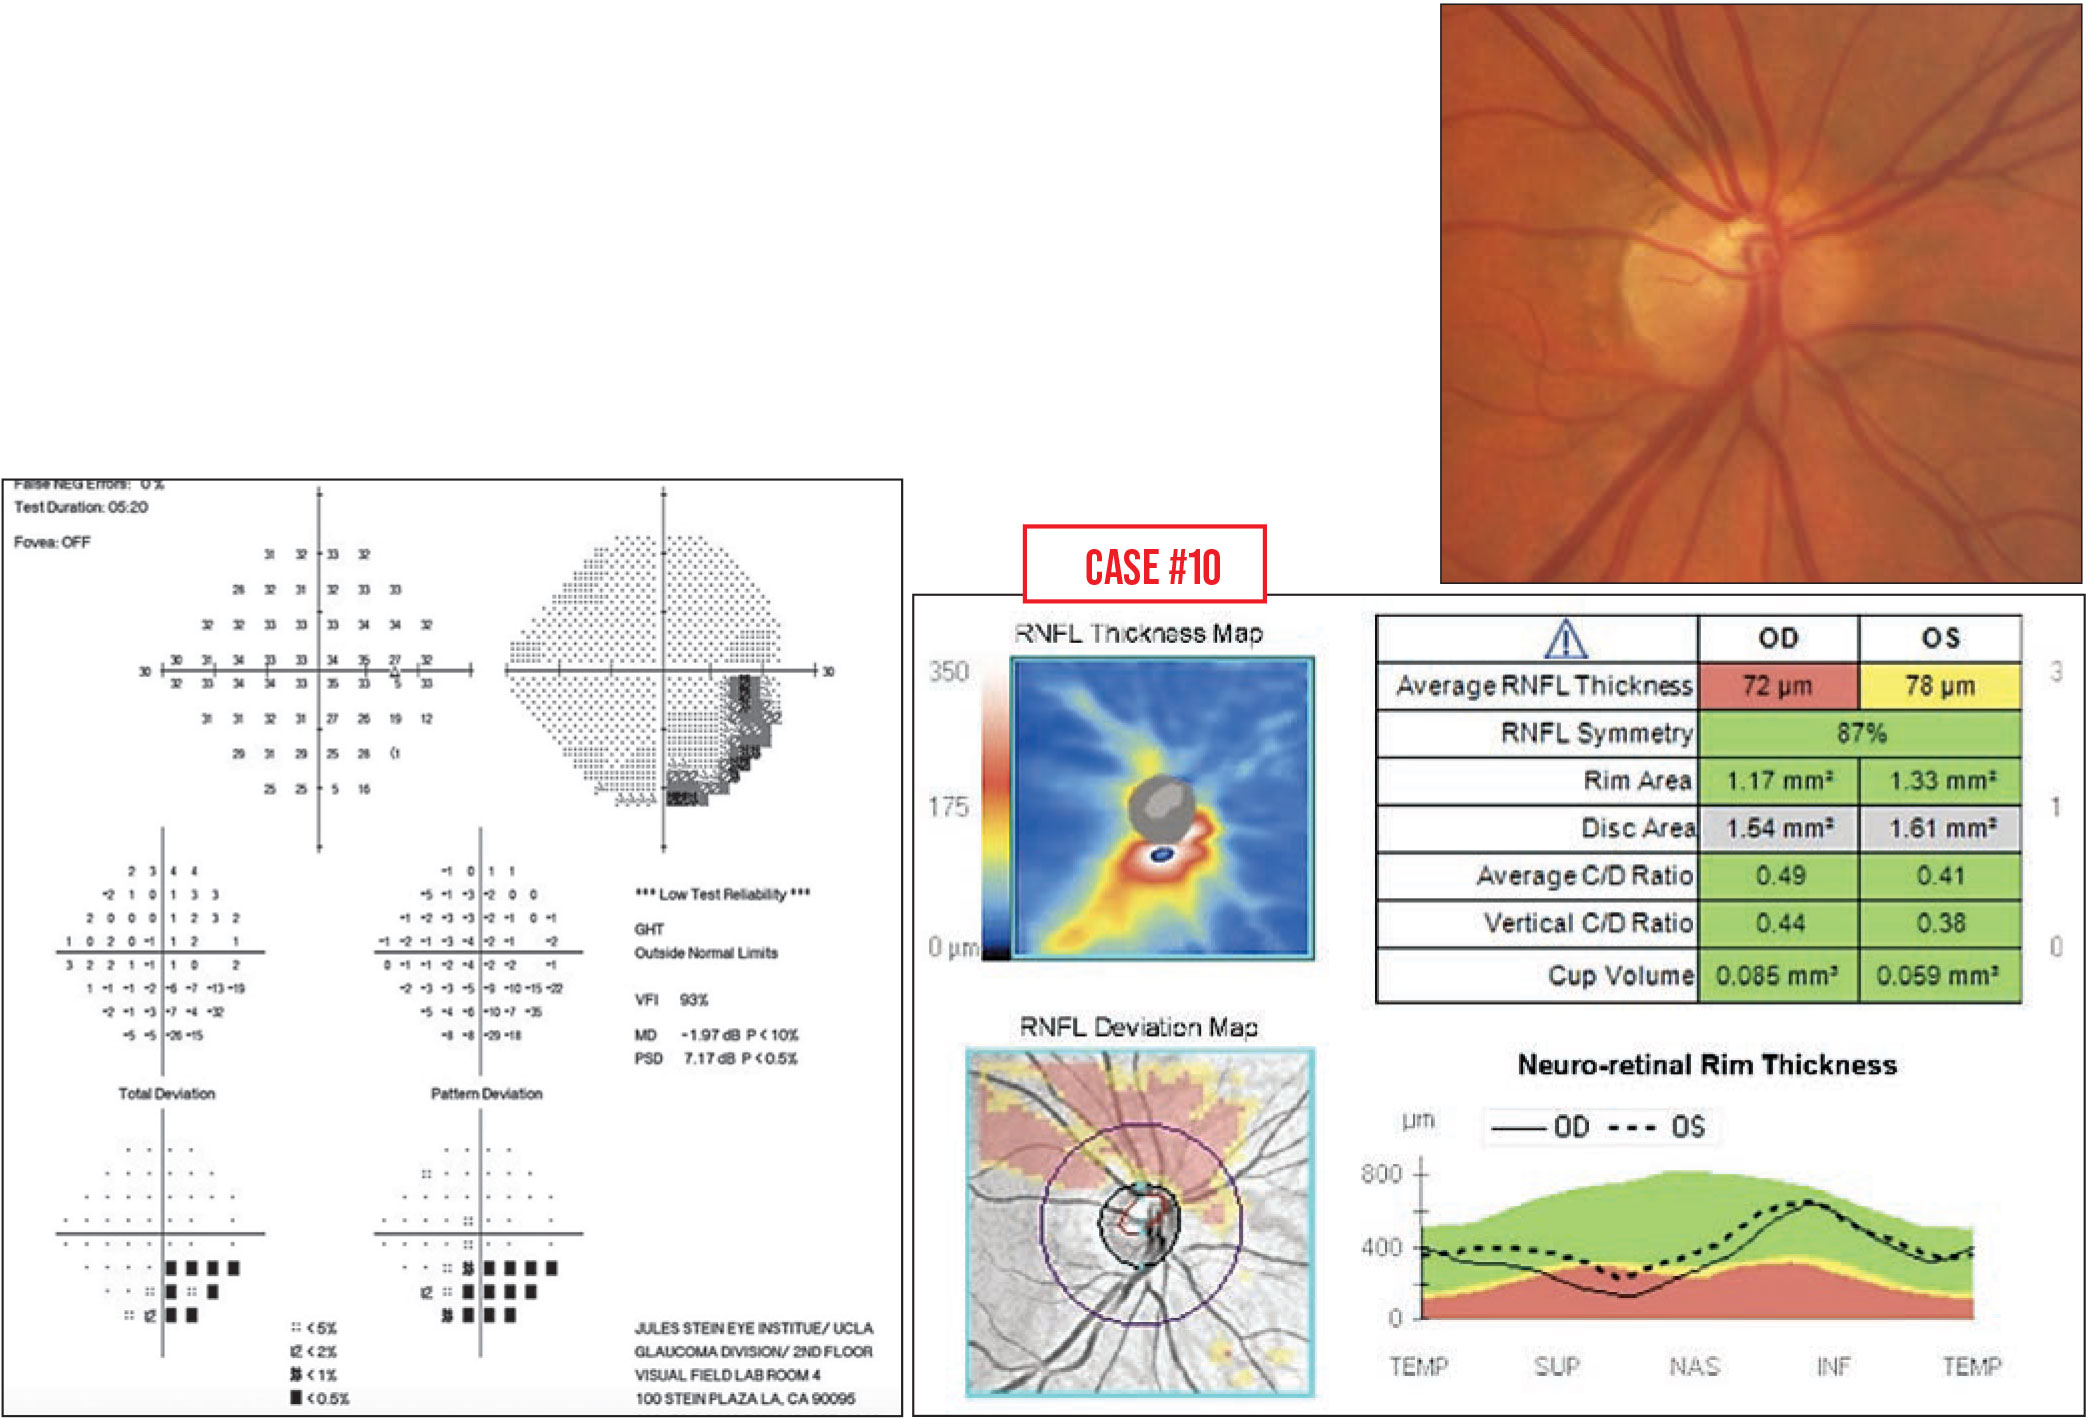 |
Case 10. This is the visual field of a woman sent to me for a second opinion. She was 34 years old, and had been prescribed glaucoma medications because she had an inferior defect on her field. She wanted a second opinion.
Looking carefully at the printout, the pattern deviation map does resemble glaucoma, but there’s something odd when you look at the grayscale map. Often, glaucoma starts in the nasal step area and then spreads back to the nerve, but here, it looks like the defect is coming off of the blind spot.
As always, it’s important to correlate field defects to the physical exam. In fact, her optic nerve looked a little strange (below, right). The person who started her on drops noticed that the superior blood vessels were very close to the rim of the nerve and thought that was glaucomatous thinning. However, if you make a line through the avascular trunk, you can see that the lower half of the nerve has a different radius than the upper half; it actually looks like the upper half is smaller. Furthermore, when you look at this patient's OCT, on the deviation map (below) there’s thinning of the entire upper half of the nerve.
This is an example of superior segmental optic nerve hypoplasia, which isn’t common. Reports in the literature show a correlation between superior segmental hypoplasia and gestational diabetes. In my patient's case, her mother never had diabetes; this may just have been an unfortunate developmental coincidence.
The important thing is that this problem doesn’t progress, so we stopped her eye drops. We’re just following her.
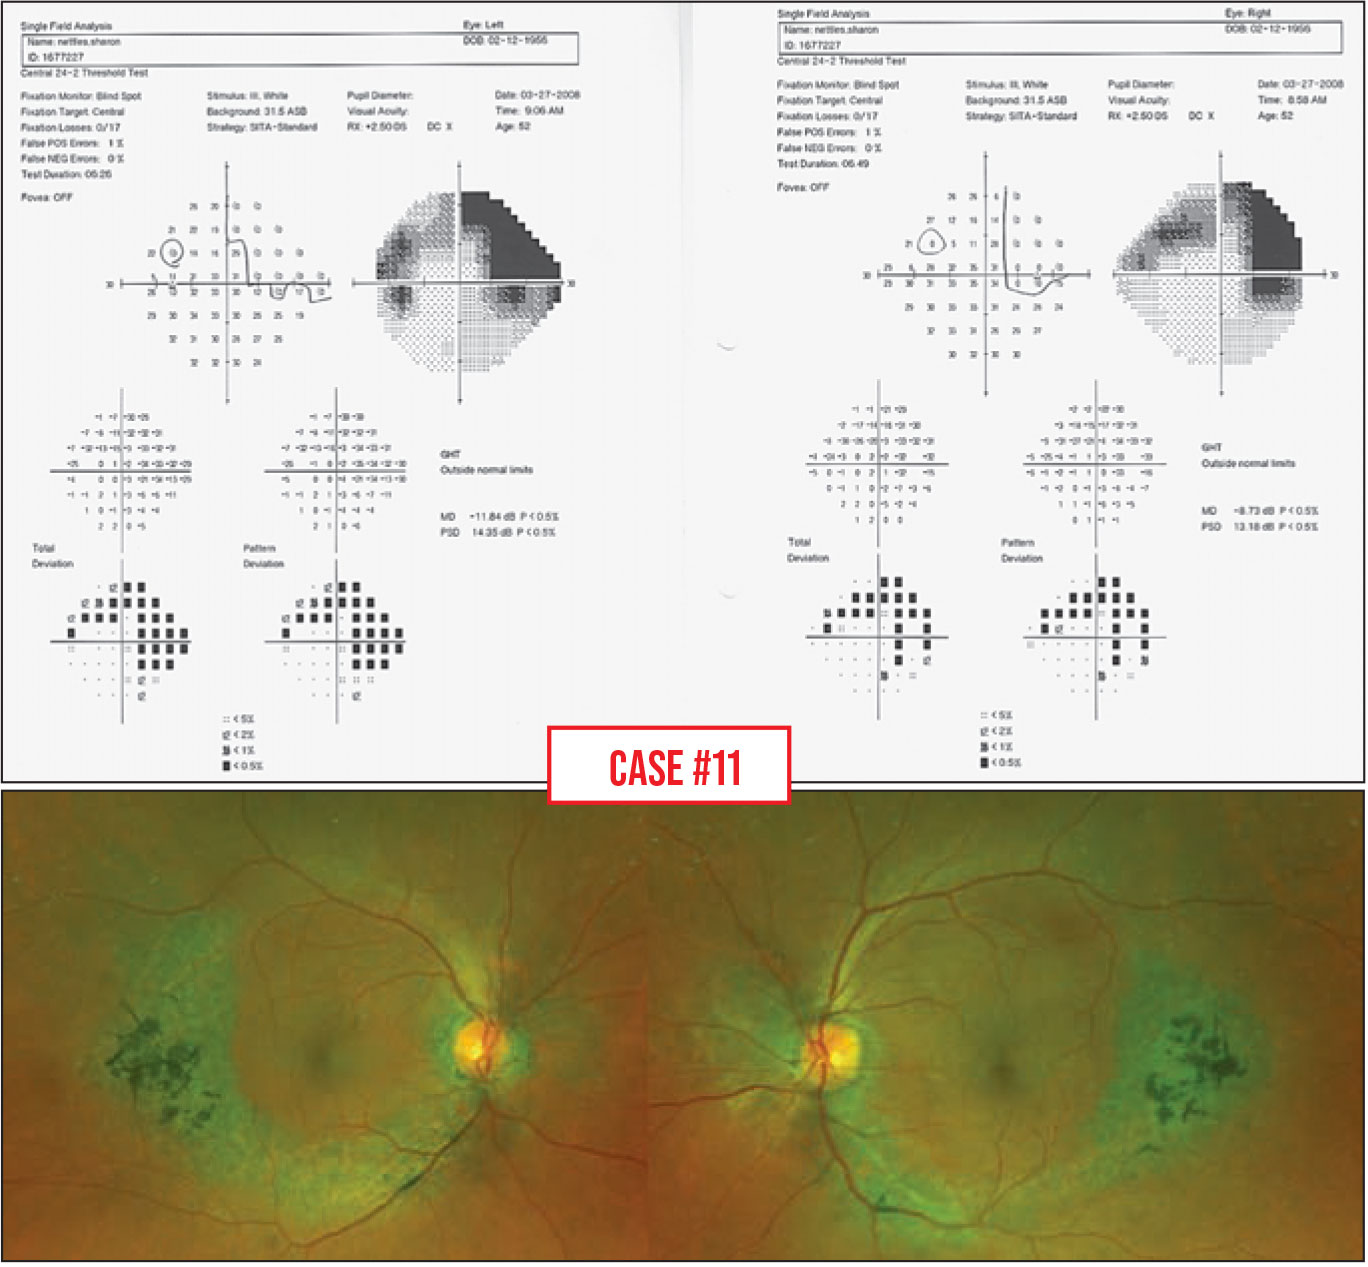 |
Case 11. This patient has impressive superior arcuate and inferior nasal step defects. However, looking at the grayscale map, the defects don’t appear to be typically glaucomatous. For such an advanced arcuate scotoma, one would expect more paracentral involvement, and there’s a lot of temporal depression.
Again, the physical exam is incredibly important. The nerves look normal, but on the retina there’s a pigment epithelium abnormality in a circular shape, mimicking retinal nerve fiber layer defects.
This isn’t glaucoma; it’s a retinal problem. Again, this demonstrates the importance of looking carefully at the patient. One can’t base a diagnosis on only one or two tests without examining the patient.
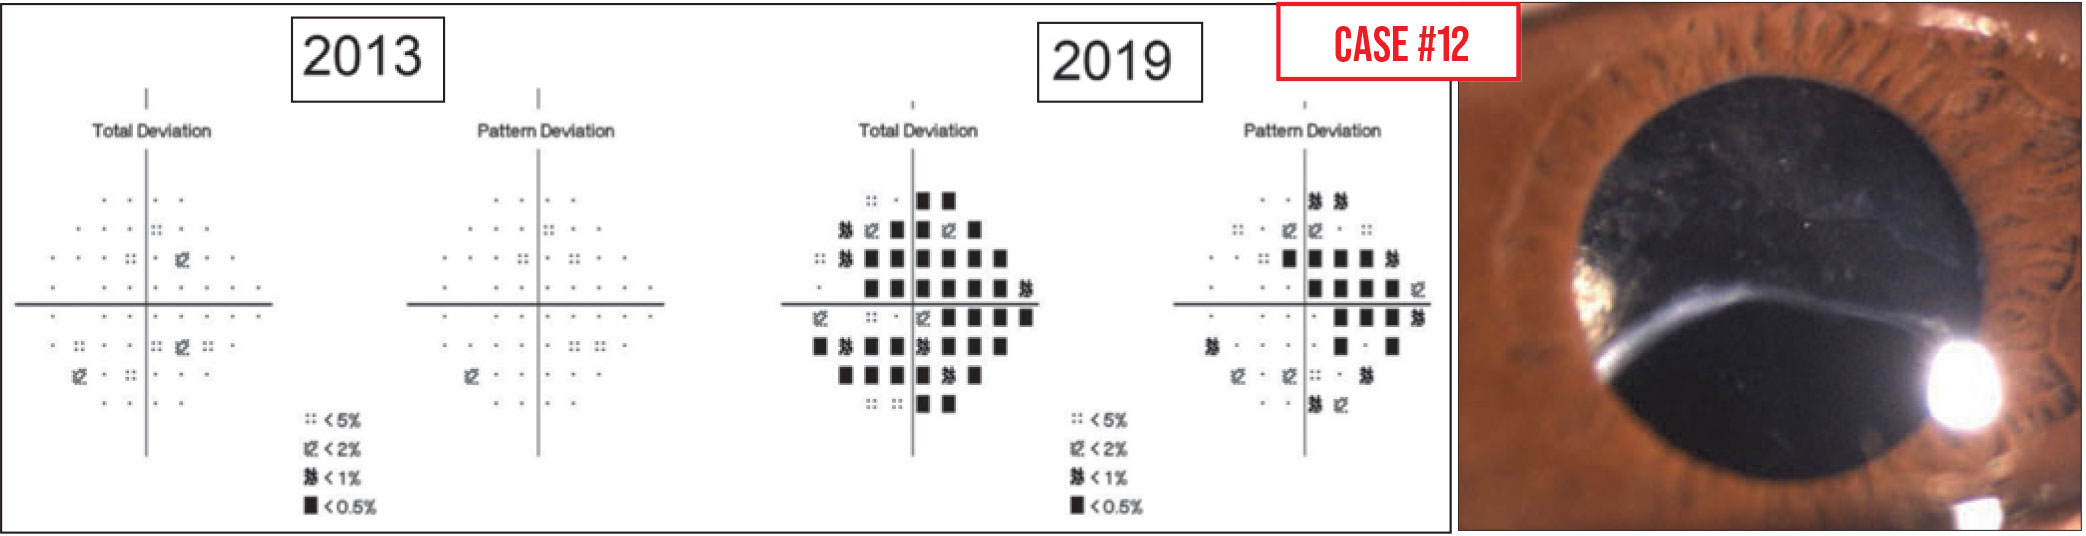 |
Case 12. This patient has pseudoexfoliation and high pressures, and his visual fields appear to show considerable progression over a six-year period. However, it turned out that because of the pseudoexfoliation, his IOL was sinking inferiorly over time and his superior opacified capsule came to lie in the visual axis, making it very likely that the visual field “progression” was caused by the capsule opacity, rather than increased optic nerve damage.
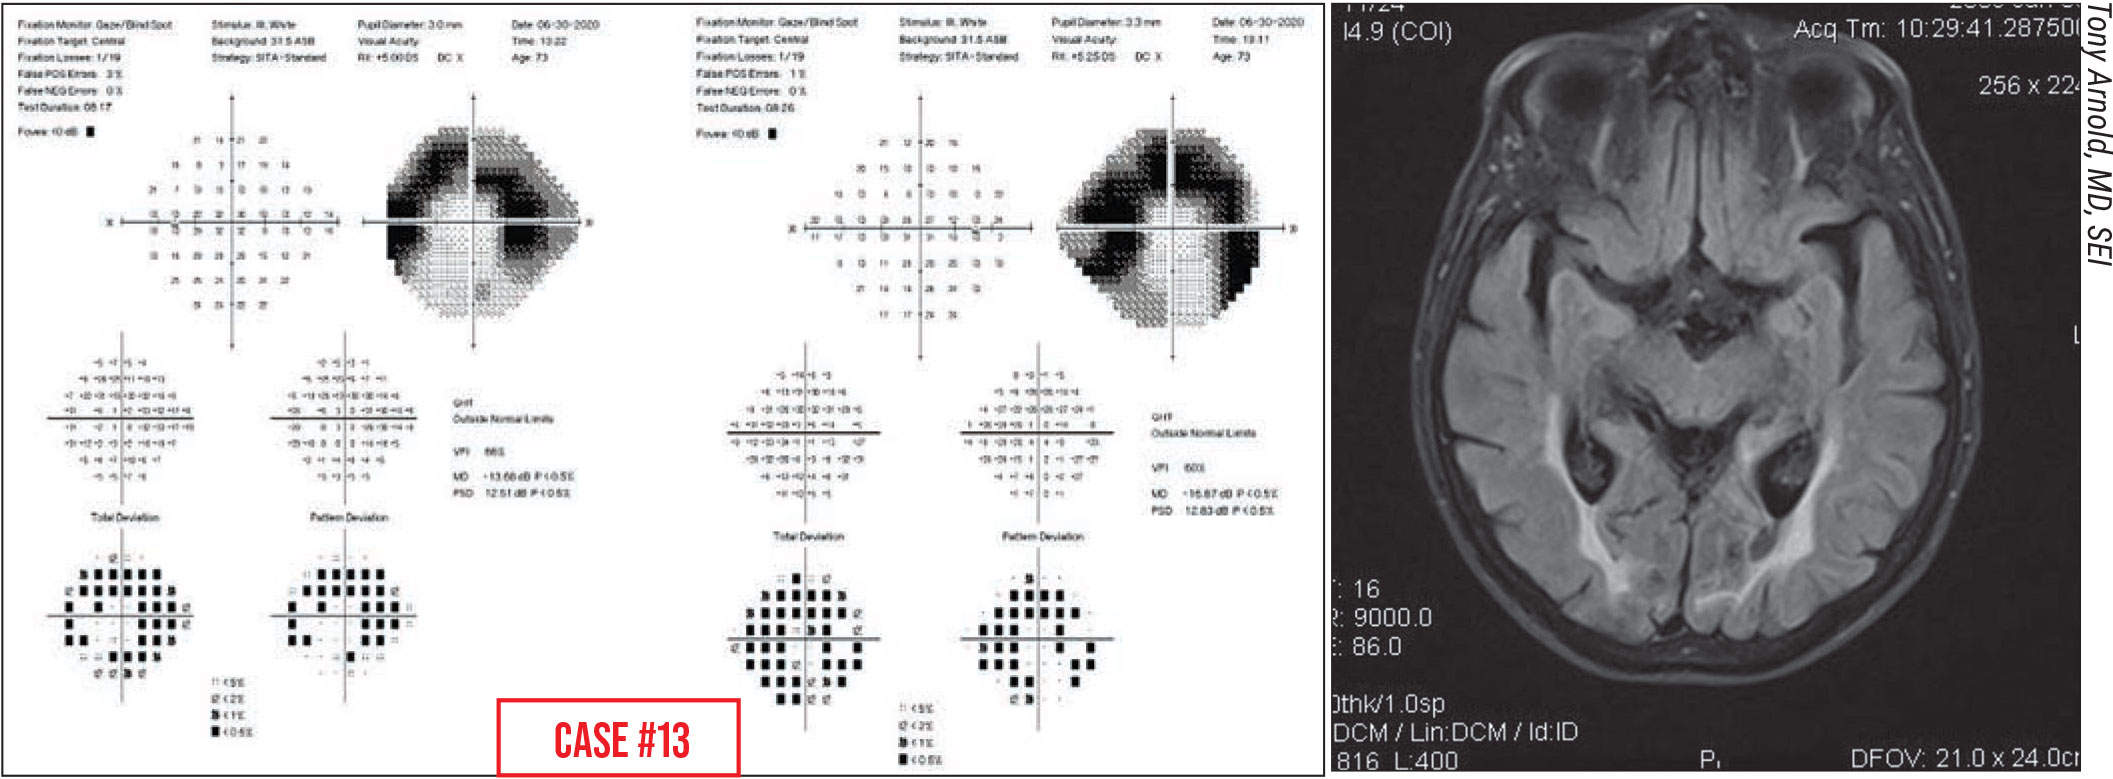 |
Case 13. This is a 72-year-old woman seeking a second opinion after she was told to start glaucoma drops. She reported that she suddenly noticed peripheral vision problems. If you only look at the total deviation and pattern deviation plots, you might conclude that the patient has a superior arcuate scotoma and inferior nasal step.
However, if you look at the grayscale map, it doesn’t look typically glaucomatous. In the right eye, I’d expect that the nasal step area would be a lot denser than the rest of the arc if glaucoma was the cause. It’s also important to look at the left and right eye visual fields together, because here the left and right sides of both images look very similar.
The other clue here is that the patient stated that she suddenly noticed peripheral vision problems. With glaucoma, people don’t usually suddenly notice defects; they come on gradually. Often, patients are unaware of their scotomas until they start to affect central vision. So that history, combined with the way her visual fields looked, and the fact that her nerves looked normal, led us to request an MRI scan, which showed bilateral occipital stroke. (MRI shown is same condition from a different patient.) It happened to result in what looks like a superior arcuate scotoma.
This is not glaucoma; these are two incomplete homonymous hemianopsias that form arcs in each eye.
Case 14 (not shown). Occasionally the latest visual field in a series may look very different from previous fields, with no apparent explanation. What might account for this?
One possible explanation is that the patient received slightly different instructions from different technicians; different instruction can profoundly affect how the patient does on the test. That’s because one of the things the test is doing is trying to find the threshold of light dimness that patients can see 50 percent of the time. It’s showing patients some pretty dim lights, and patients can have a hard time being sure if they really saw them. When they’re unsure, the technician’s instructions can make them more inclined to choose one way or the other, affecting the outcome. This is called “response bias.”
If the patient is told: “Press the button the moment you think you see a light,” the test may come out looking really good, close to normal, even if the patient has field defects. But if the patient is told: “Don’t press the button unless you’re 100-percent certain you’ve seen a light,” the test results can make it appear that the patient’s vision is much worse than it actually is. On the other hand, more neutral instructions, such as: “Press the button whenever you see a bright or dim light. You’re not expected to see all of them,” tend to produce more representative results. (An excellent example can be found in Kutzko et al, 2000.1)
So, if you’ve been following a patient for some time and suddenly the visual field looks a lot better or worse—and you know there are no false positive or negatives and everything else seems to be OK—you may want to check to see if your technician decided to change their patient instructions.
Strategies for Success
Here are some pearls that will help ensure accurate interpretations of questionable visual fields:
• If the test shows something you weren’t expecting, look for correlations in the physical exam and OCT scans. This can prevent a visual field artifact from leading you to a misdiagnosis and inappropriate treatment.
• Don’t overlook the grayscale plot. When we teach residents to interpret a visual field, we always say, “Don’t look at the gray scale—look at the pattern deviation plot.” But some artifacts, such as the classic cloverleaf pattern indicating false negative responses, are much more readily appreciated in the grayscale plot. So the grayscale map is always worth looking at.
• Some tests with artifacts can be used to judge whether progression has occurred—but others can’t. A test with a higher number of fixation losses may still be used for judging progression, but a test with a high rate of false positives should not be.
• If the 24-2 strategy you’re using has stopped being useful, switch to an alternate version of the test. I’ve seen cases in which patients continued to be administered the 24-2 visual field, even though the pattern deviation plot returns with the message “pattern deviation not shown for severely depressed fields.” At some point you need to switch to a test strategy that’s more useful for following progression. For some patients, that may be a 10-2 field, because all they have left is their central field; for others, the visual acuity may not be good enough to see the size-III stimuli (4 mm2) that the machine projects, so you have to switch over to a size V stimuli (64 mm2).
Don’t let yourself (or your techs) get in a rut. You need to individualize the test for some patients.
• Make sure the 10-2 test administered isn't using the red stimulus light. These machines are capable of testing the 10-2 field test using a red stimulus light, which, for a while, was recommended for Plaquenil screening. I’ve seen technicians assume that all 10-2 testing should be done using the red stimulus. Others simply don’t notice that the stimulus light has been set to red.
Unfortunately, test results always look worse when a red stimulus is used. It’s simply harder for most people to see the red stimulus.
Dr. Giaconi is health sciences professor of ophthalmology at the Jules Stein Eye Institute, David Geffen School of Medicine, UCLA, Los Angeles. She is a consultant to Allergan.
1. Kutzko KE, Brito CF, Wall M. Effect of instructions on conventional automated perimetry. IOVS 2000;41:2006-2013.