Mathieu Gauvin, MD, and Avi Wallerstein, MD, principal investigators from the McGill University Refractive Surgery Research Unit in Quebec, Canada, have developed a free software program called mEYEstro that automatically graphs refractive surgery outcomes. Here’s how the two physicians created the program and what their technology can offer refractive surgeons.
Intro to mEYEstro
“Initially we noticed that many published articles weren’t adhering to the standards recommended by the journals for outcomes reporting,” says Dr. Gauvin when explaining how he and Dr. Wallerstein came up with the concept for mEYEstro. In 2023, the team of physicians published a study to show the efficacy, safety, accuracy and stability of their software.1 They explained in their paper how other available online tools could help with graphing, but nothing streamlined the process while meeting the academic standard needed.
 |
|
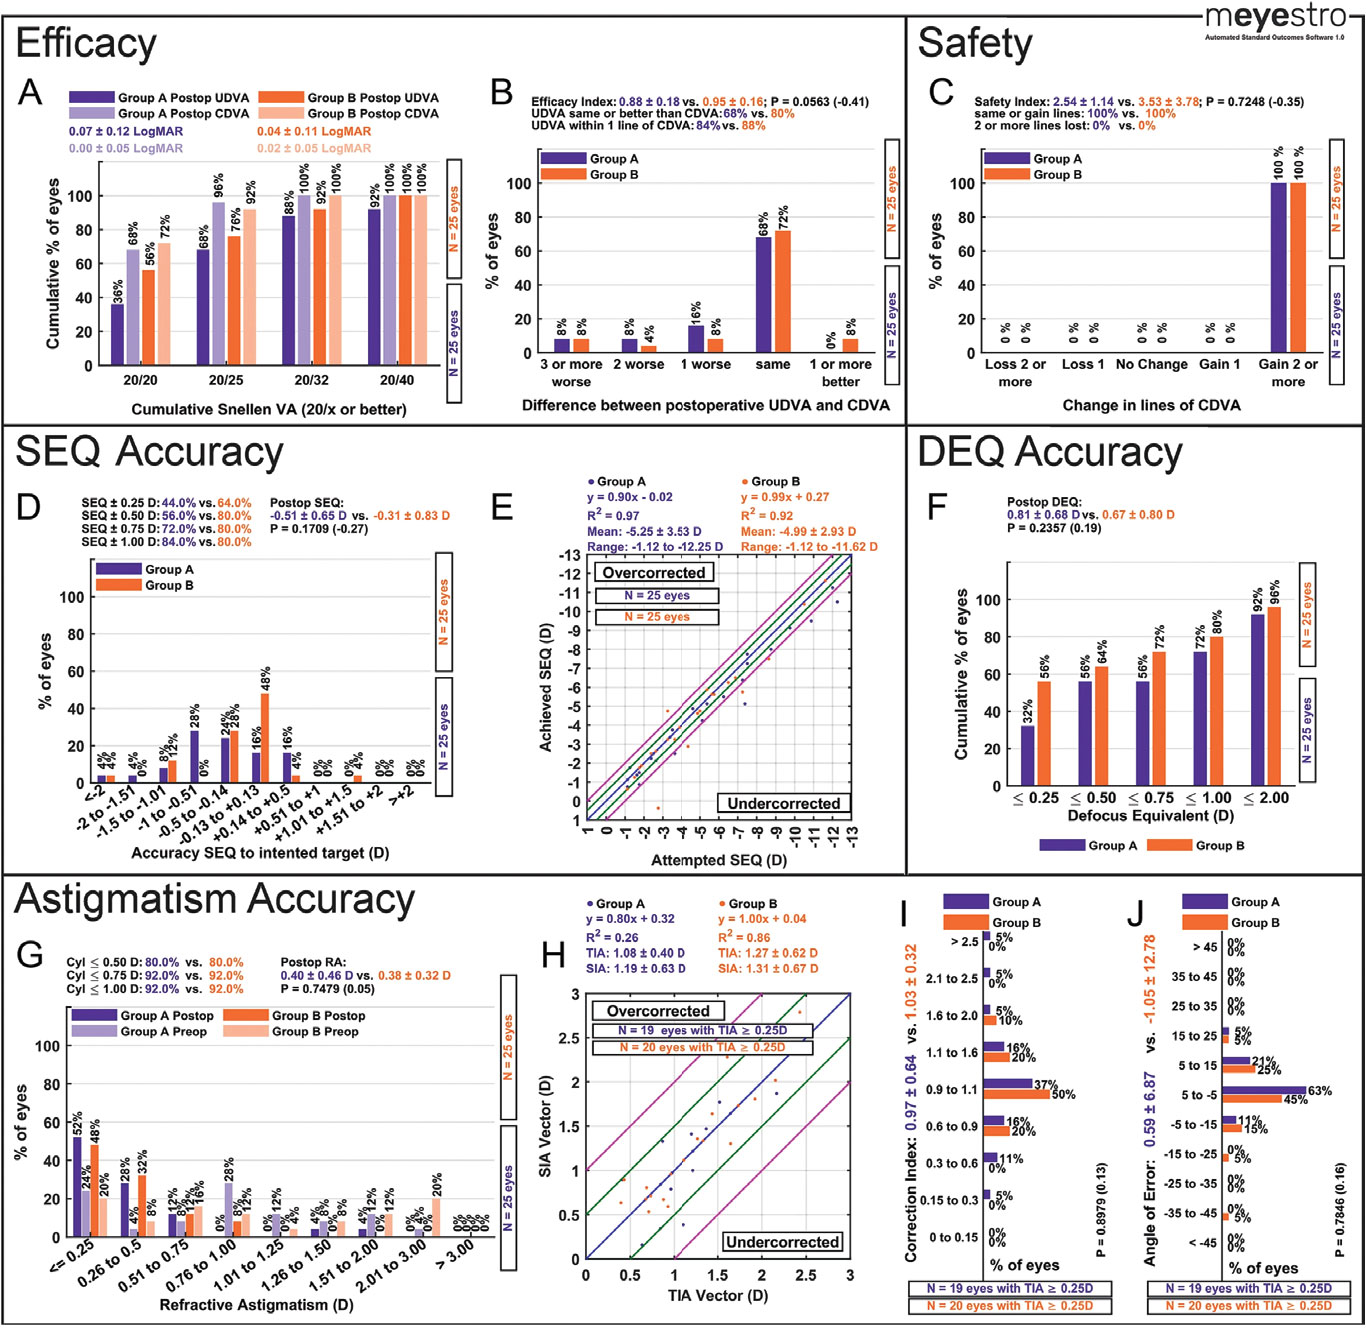
An example of graphs produced by mEYEstro. This dataset was used to investigate the outcomes of surgery between two groups. |
“We then identified a significant gap in the available tools for refractive surgery outcome analysis,” continues Dr. Gauvin. “Existing software solutions were either too expensive, required manual data entry, were prone to user error or weren’t comprehensive. We wanted to create a user-friendly, automated tool that would simplify and expedite the process of generating standardized refractive surgery graphs and performing statistical analyses.”
During the development process, Drs. Gauvin and Wallerstein encountered some obstacles. “One major challenge was ensuring that the software could perform accurate and automated statistical analyses and generate high-resolution graphs with minimal user input,” says Dr. Gauvin. “We also had to ensure compatibility with widely used data formats and maintain user data security and confidentiality. Overcoming these challenges required rigorous testing and iterative improvements and ‘beta user’ feedback.”
In their 2023 study, the team of physicians cited the works of Dan Z. Reinstein, MD, and George O. Waring III, MD, whose studies set the standards for graphing refractive surgery results. The mEYEstro software was developed to adhere to Drs. Waring and Reinstein’s terminology, calculations and graphical representations. Additionally, when comparing two groups in a study, the software automatically selects and plugs the data into the appropriate hypothesis test. The software can run tests such as the Kolmogorov-Smirnov test, unpaired sample T-tests, paired sample T-tests, non-parametric Mann Whitney U-tests and non-parametric Wilcoxon signed-rank tests.
When conducting their study, Drs. Gauvin and Wallerstein designed three data files to upload to the software in order to test the efficacy, safety, accuracy and stability of their software. “The data files were designed to be straightforward and compatible with Microsoft Excel, a widely used program in both clinical and research settings,” explains Dr. Gauvin. “We defined 20 columns, including 15 mandatory ones for the essential preoperative and postoperative refractive data, and five optional columns for additional stability data points. This design ensures that the software can automatically generate accurate and comprehensive graphs based on standardized input formats.”
According to the study, mEYEstro is capable of generating 11 standard graphs for the following:
• cumulative UDVA and CDVA;
• difference between UDVA and CDVA;
• change in lines of CDVA;
• spherical equivalent to intended target;
• attempted vs. achieved SEQ;
• defocus equivalent accuracy;
• refractive astigmatism accuracy;
• target-induced astigmatism vs. surgically induced astigmatism;
• correction index histogram; and
• angle of error histogram and SEQ stability overtime.
Each graph can be downloaded individually or combined as a TIFF image file.
“Currently, mEYEstro works exclusively with Excel spreadsheets due to their widespread use and simplicity,” says Dr. Gauvin. “Implementing compatibility with Google spreadsheets or other programs would require additional development and testing. While there are no immediate plans to add this feature, we’re open to user feedback and may consider it for future updates based on demand. To date we haven’t had such a request. It’s also our understanding that Google users can save their spreadsheet as an Excel file; so technically this shouldn’t be a big hurdle.”
Interfacing with mEYEstro
While there are tutorials on YouTube that explain how to use the mEYEstro software, the 2023 study provides in-depth instructions on how to download and use the program. The software runs using the MATLAB runtime compiler, which allows the software to run independently on the desktop. This installation program will download along with mEYEstro.
Physicians interested in downloading the mEYEstro software can find the link in the 2023 study or search for the file on https://www.lasikmd.com/media/meyestro. Once the program is installed, the user can open it up on their desktop and begin uploading their data.
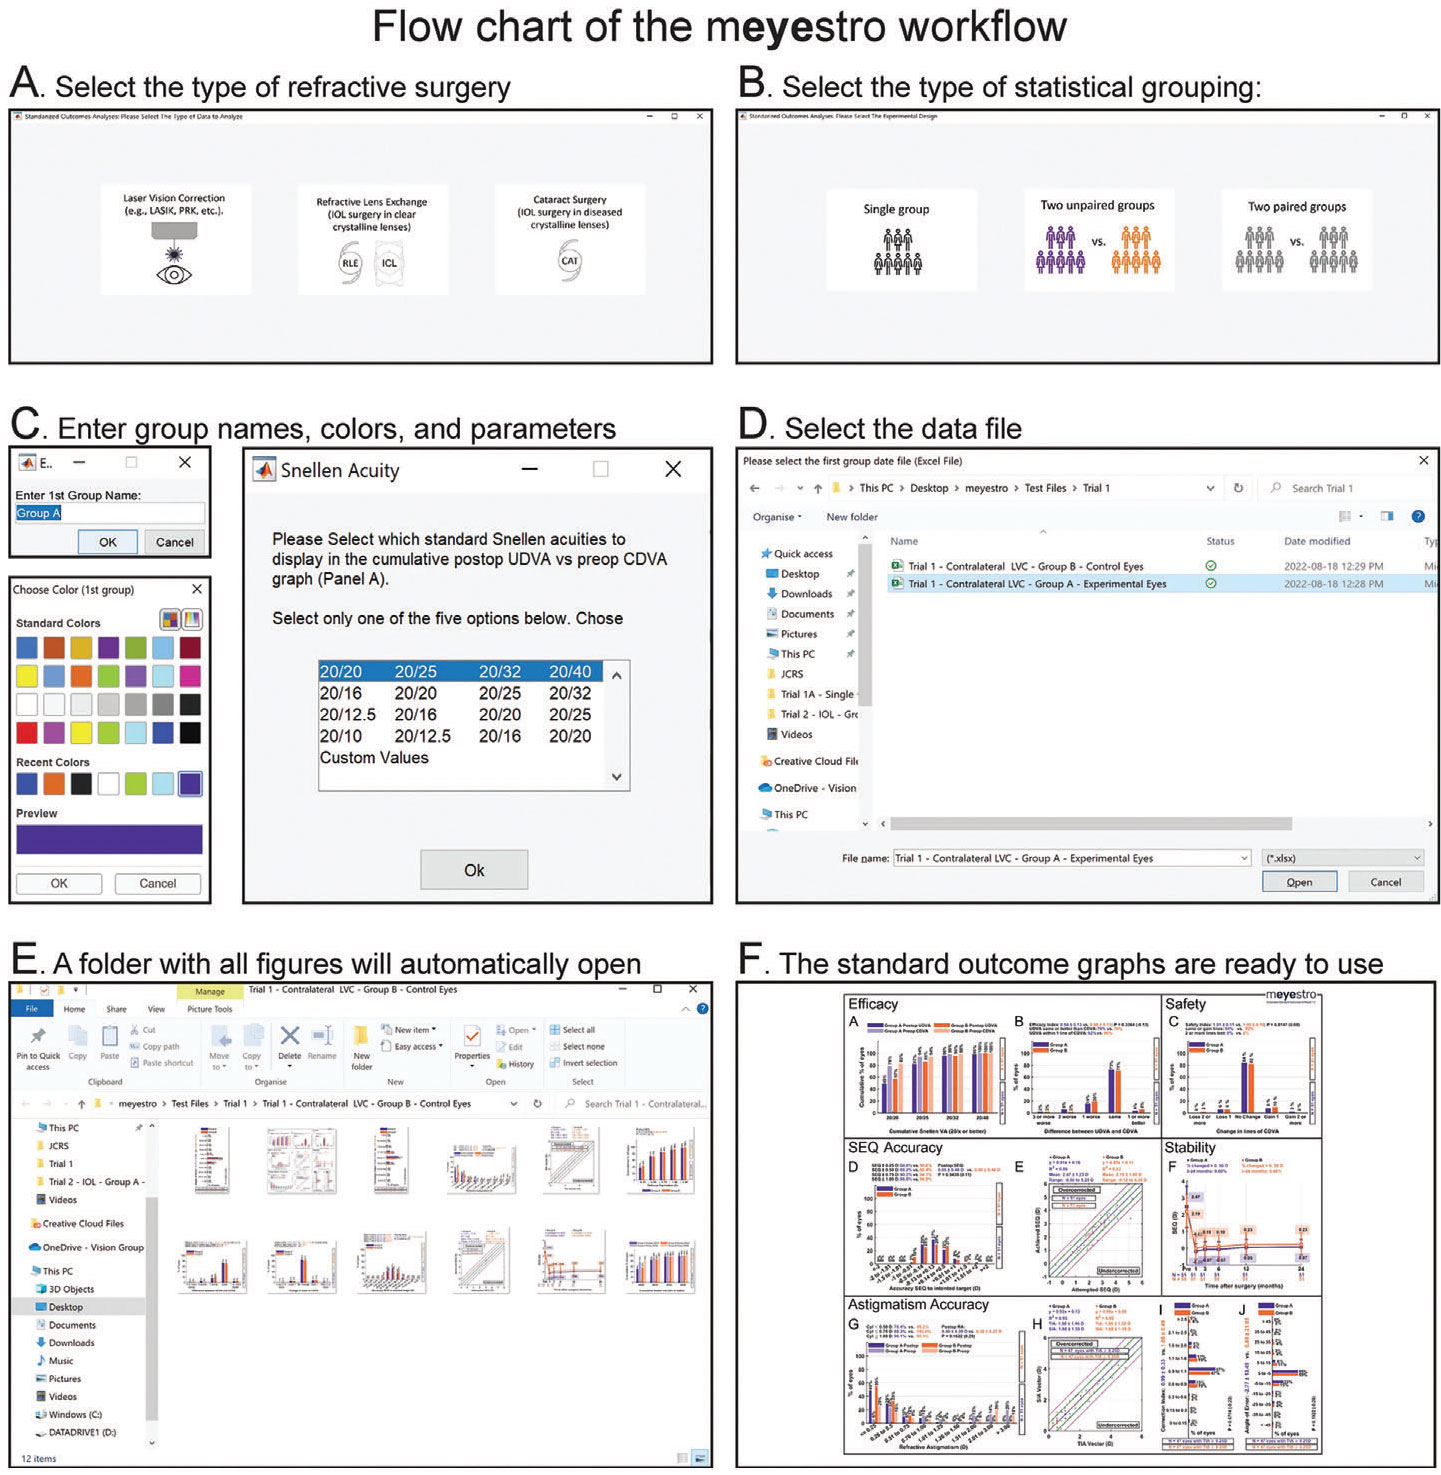
The mEYEstro software begins by asking what type of refractive surgery procedure was performed. Then, the user can choose whether their study analyzed a single group, two unpaired groups or two paired groups. Following this step, the software will ask the user to customize their study’s group names and colors, and set parameters for the study’s outcomes. This is when the user uploads their dataset from Excel. Afterwards, the software shares a ZIP file containing multiple TIFF images of accurately graphed outcomes.
“The most unique feature of mEYEstro is its ability to automatically generate all required graphs and perform statistical analyses within 30 seconds with minimal user inputs,” says Dr. Gauvin. “This automation saves time and reduces the risk of user error, making the analysis process efficient and reliable.”
 |
|
The software is easy to use and provides physicians with a host of customization options. Above are simple steps for creating graphs for refractive outcomes. A detailed tutorial is available on the Refractive Surgery Research Unit’s YouTube channel (https://www.youtube.com/watch?v=NFlRRHx6ZaI). |
Before downloading mEYEstro, physicians will need to agree to the terms and conditions expressed by Lasik MD. Basically, they want physicians to acknowledge the developers of the software when publishing mEYEstro’s graphs in any publication or presentation. Simply cite the 2023 study or use the citation in the footnotes below if mEYEstro is used for outcomes graphing.
“We have seen a significant number of downloads since the release of mEYEstro,” adds Dr. Gauvin. “Our published article is approaching 2,000 views since its release, and many have downloaded mEYEstro and viewed our tutorial video. We expect this number to start increasing significantly as more people become aware of its availability, as was the case with our other software, AstigMATIC, which has now been used in nearly 75 peer-reviewed papers since 2018, with 30 of those in the last year alone. The positive feedback and widespread interest suggest that the software will eventually be widely adopted by the ophthalmology community.”
Continuously Developing
There’s always room for improvement and Drs. Gauvin and Wallerstein are already working on the next updates for mEYEstro.
“Users can expect enhancements that provide more detailed corneal cross-linking specific analyses, direct LogMAR data entry and advanced nomogram features so they can easily improve their future outcomes,” shares Dr. Gauvin. “These updates will improve the software’s capability to provide comprehensive and precise refractive surgery outcome analyses. We’re also working on providing a web-based version of mEYEstro. Practitioners could then choose between the downloadable or web format.
To broaden their footprint in ophthalmology, the team of physicians have developed AstigMATIC, a tool that automatically generates advanced standard vector graphs. But mEYEstro and AstigMATIC aren’t the only endeavors Drs. Gauvin and Wallerstein want to share with the public. There are plans in the future to continue developing and updating programs.
“Currently, mEYEstro and AstigMATIC are our primary contributions to the field of ophthalmology,” mentions Dr. Gauvin. “However, we’re currently exploring opportunities to develop new tools that can address other needs within eye care and potentially other medical specialties. User feedback and emerging needs in the field will guide our future projects. For example, we’re working on making a new tool called TxFix that’ll be available to the community. This tool will allow surgeons that had unfortunately treated the wrong script to immediately calculate the expected refraction while the patient is still on the bed, allowing them to immediately treat the error.”
While TxFix is still under development, physicians can use mEYEstro and AstigMATIC in a clinical setting to improve procedural outcomes. “By providing standardized graphs and statistical analyses, clinicians can quickly understand the efficacy, safety, accuracy and stability of their procedures, identify trends, and make evidence-based decisions to optimize patient outcomes,” shares Dr. Gauvin. “For busy surgeons, mEYEstro simplifies the process of analyzing and presenting clinical outcomes on a single page view, which is crucial for improving our understanding of surgical results.
“We invite the community to share their experiences and suggestions to help us make mEYEstro even better,” continues Dr. Gauvin. “We’re excited to see how mEYEstro will continue to contribute to the field of ophthalmology and improve patient care.”
1. Gauvin M, Wallerstein A. mEYEstro software: An automatic tool for standardized refractive surgery outcomes reporting. BMC Ophthalmology 2023;23:171.
Drs. Gauvin and Wallerstein have no financial interests to disclose.