The Setup
Commercial systems are now available that require minimal setup and staff training and allow more consistent, standardized measurements. The signals recorded vary between systems due to differences in filtering, amplification, averaging, stimuli and other aspects, so temporal changes should be made using the same system.1 Here we review the main diagnostic tests, the techniques, and the signals recorded.
Multifocal ERG
The mfERG is an objective measure of cone-driven central retinal function.2 A hexagonally patterned array stimulates different areas in a pseudo-random pattern.2 The recorded signals are mathematically processed utilizing “binary m-sequences” to generate a topographic map of retinal function.2,3 Areas of retinal dysfunction are identified by spatially comparing variations in the topographic array of signals.
Data is displayed (See Figure 1) as a trace array, 3-D density plot, and regional average data in a 2-D plot or waveform tracing.
|
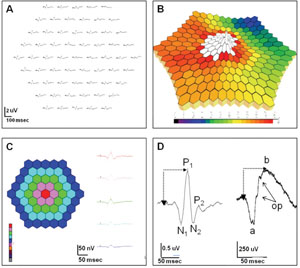
Trace arrays are composed of individual biphasic waveforms (See Figure 1D, left), which have some resemblance to the standard full-field ERG (ff-ERG), with an initial negative wave (N1) followed by a positive deflection (P1), similar to the a- and b-waves of the ff-ERG (See Figure 1D, right). While there is data to suggest that N1 represents the outer retinal activity associated with phototransduction (similar to the a-wave) and the P1 response contains signal activity from the inner retina (similar to the b-wave), the stimulus and mathematical signal processing as well as the spatial differences (full-field versus central) and lack of rod contribution make a direct correlation impossible. Hence, the mfERG cannot replace the information provided by the ff-ERG.
The mfERG can be recorded with varying numbers of traces, with or without signal averaging. Higher number arrays result in more precise data, but provide a lower signal-to-noise ratio, as well as longer testing time. The International Society for Clinical Electrophysiology of Vision (ISCEV) recommends 61 or 103 tracings.4
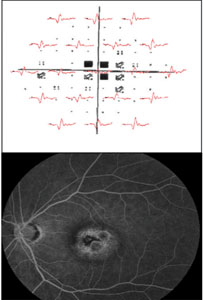
An mfERG abnormality (suppressed signal) usually correlates well with visual-field defects (See Figure 2). Cataracts may influence mfERG recordings due to light scattering. Refractive error and axial length should also be accounted for when analyzing mfERG signals.3
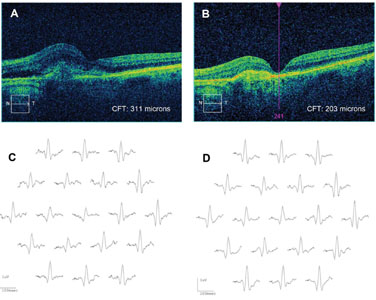
Clinical applications of mfERG. Drug toxicity is a leading indication for the mfERG, which is more sensitive than the ff-ERG in detecting cases of toxicity caused by drugs affecting the macula. These include the anti-malarial (anti-inflammatory) drugs chloroquine, hydroxychloroquine and quinine; anti-tuberculosis drugs including ethambutol; anti-epileptic drugs like vigabatrin; and antipsychotic medications including thiothixene. Other applications include detection of non-organic vision loss; dysfunction from inflammatory disease (especially birdshot chorioretinopathy); and dysfunction caused by vascular disease, including diabetes and retinal vein occlusion, presumably as the result of ischemia and sometimes out of proportion to the clinical findings.5 Retinal degenerations can be monitored with the mfERG; residual cone function is detected in retinitis pigmentosa and it is suppressed in X-linked retinoschisis. We have found a robust initial mfERG to be a predictor for improved retinal function after anti-vascular endothelial growth factor therapy in wet age-related macular degeneration (See Figure 3), though long-term sequential treatment with anti-VEGF drugs can be associated with an overall decrease in the mfERG even when vision appears relatively preserved.6 This may be a useful measure in assessing long-term benefits of other drugs such as the anti-platelet-derived growth factor inhibitor, Fovista.
|
| mfERG Tips: Improve the signal to noise ratio by dilating
the pupil, increasing the stimulus intensity and reducing the trace
array number. Make sure the patient maintains fixation so results are
reproducible and 3-D plots are accurate.
|
Full-field ERG
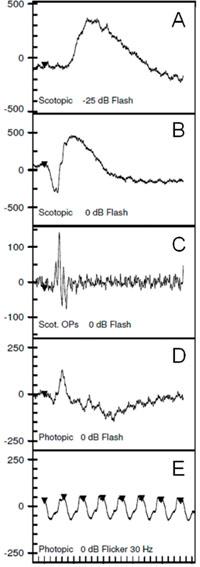
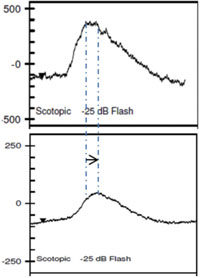
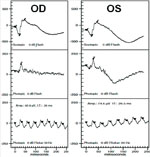
The ff-ERG is a measurement of the summed mass electrical response of the retina under maximally dilated photopic and scotopic conditions. The ISCEV protocol includes five components designed to isolate rod and cone function as shown in Figure 4. Dark-adapt for 20 minutes before the scotopic ERG is recorded and light-adapt with a Ganzfeld background illumination of 30 cd/m2 for 10 minutes before recording photopic signals. A bright flash elicits a biphasic response, the negative a-wave followed by the positive b-wave (See Figure 3B).
The two primary measures are the wave amplitude and implicit times (onset of flash to peak or trough of wave). The a- and b-waves originate primarily in the outer and inner retina, respectively. An abnormal ff-ERG result occurs when approximately 20 percent of the retina is compromised.7 The signal is recorded with alternate current rather than direct current amplification, allowing only fast ERG signals to be detected (a-waves and b-waves rather than slower c-waves, fast oscillation and light peak potentials).8-9
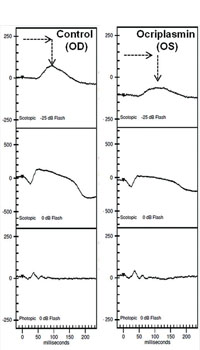
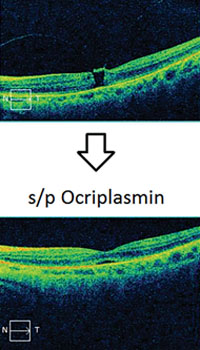
Clinical applications of ff-ERG. The most common use is detecting a hereditary degeneration and differentiating it from other causes. In RP the ff-ERG is often the definitive test and the scotopic a- and b-waves are generally extinguished early in autosomal recessive and X-linked RP.10 A suppressed but intact b-wave may be seen in autosomal dominant RP and the increased implicit time may be helpful in making the diagnosis (See Figure 5). Leber’s congenital amaurosis presents with an RP-like picture of the retina and is also associated with markedly reduced ff-ERG signals. Congenital stationary night blindness is identified with the ff-ERG—usually a negative signal with a-wave greater than b-wave—and accounts for 10 to 20 percent of blindness in children.11 Evaluation for unexplained vision loss with ff-ERG should be performed before initiating a costly workup. X-linked Juvenile Retinoschisis (XLRS) also manifests as a negative waveform ERG, and is the result of a mutation of the RS1 gene, causing microcystic changes in the macula.12 Cone degeneration can be detected and distinguished from Stargardt’s disease or other bull’s-eye maculopathies using the ISCEV test protocol. The b-wave is useful for predicting rubeosis in central retinal vein occlusion. An implicit time greater than 50 msec and inter-eye difference of greater than 8 msec is highly predictive.13,14 In such patients we initiate anti-VEGF therapy followed by panretinal photocoagulation laser treatment early in the course of the disease. The ff-ERG may also be particularly useful for identifying malingering associated with profound visual field loss (See Figure 6). Chemical vitrectomy with ocriplasmin was reported to cause dyschromatopsia in less than 5 percent of patients, with an associated profound suppression of the ff-ERG. We have also noted ERG suppression in the absence of dyschromatopsia in cases where the drug has been effective in the treatment of macular hole (See Figure 7). These effects appear reversible.
| |||||||||||||||||
| ff-ERG tips: Electrode contact is key for good signals. Minimize 60Hz line noise to optimize oscillatory potential recording. Be consistent with exact dark adaptation time. |
Pattern ERG
| |||||||||||||||
Electrooculography
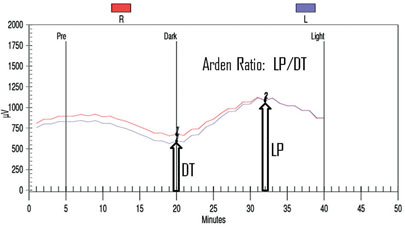
The EOG is an indirect way to measure the slow electrical responses generated by the retinal pigment epithelium, which are selectively affected in some conditions. Under direct current of the ERG, a series of slower potentials can be measured following the fast a- and b-waves, but these are lost with standard alternate current ERG recordings. The EOG is used to measure these slower potentials (usually just the light peak and dark trough, but a fast oscillation can also be identified).16 Since the retinal pigment epithelium generates a resting potential across the eye, changes in that potential can be recorded by shifting the dipole—patients look side to side and the voltage is recorded during dark-adaptation followed by a light adaptation.16 Figure 8 shows a typical EOG measurement. The response reaches its lowest trough eight to 12 minutes into the dark phase, and reaches its highest peak six to nine minutes into the light phase. The EOG amplitude is reported as the Arden Ratio: the greatest amplitude in light divided by the lowest amplitude in the dark. The size of the light peak and dark trough should approximately be 2:1 or greater, respectively. A light/dark ratio less than 1.7 is considered abnormal.
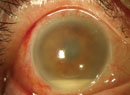
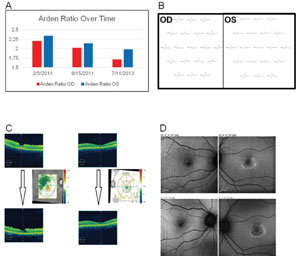
Clinical applications. The EOG has classically been used to detect hydroxycholoquine toxicity and Best disease.16,17 In case of the former, we find other modalities may be more sensitive at early detection of toxicity, including a central 10-degree visual field with red target, autofluorescence (See Figure 9), mfERG and optical coherence tomography, demonstrating foveal atrophy. Toxicity may be progressive after discontinuation of the medication and continued monitoring is in order. In addition to Best disease, other RPE dystrophies, including pattern dystrophies and the fundus flavimaculatus variant of Stargardt’s, can be associated with a suppressed EOG with typically normal ff-ERG.18
| Tip: Make sure saccades are consistent and do not overshoot and saturate the recording
system. This can underestimate the Arden ratio. |
Visually Evoked Potential
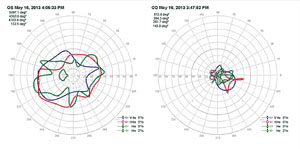
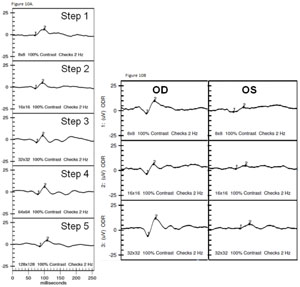
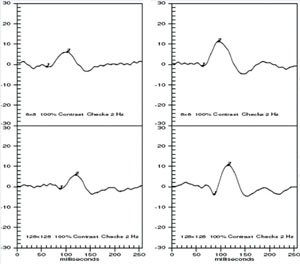
The VEP measures the function of the optic nerve and its connection between the retina and brain. A VEP stimulus may be in the form of a pattern reversal (checkerboard) or pattern onset (flash). Pattern reversal is the preferred stimulus for most clinical purposes due to fewer variations in waveform and latency compared to the flash (See Figure 10). Pattern reversal stimuli are the best choice in cooperative patients with visual acuity of 20/200 or better, particularly when testing for possible effects of optic neuritis. Smaller check sizes subtending 10 to 20 degrees (minutes) of arc are best for evaluating foveal vision. Larger check sizes subtending 40 to 50 degrees of arc are better utilized for evaluating parafoveal vision.19 The higher-intensity Flash VEP is useful when poor optics, poor cooperation (nystagmus) or poor vision limit the use of pattern reversal VEP.
|
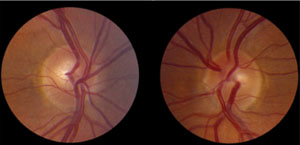
Clinical applications. The VEP is useful in assessing damage from glaucoma, retrobulbar optic neuritis, traumatic optic neuropathy (See Figure 11), compressive optic neuropathy and damage from meningitis.20 It is important to understand the limitations as noted above, but don’t underestimate the potential in complex cases where optic nerve dysfunction is difficult to confirm or quantify with other tests.
| Tips: Make sure the patient is properly refracted and note level of best-corrected vision. If vision is <20/200, a flash rather than the standard pattern VEP may be indicated. Make sure the patient is fixating on the target screen during the test. |
Dark adaptometry/Scotopic sensitivity
Dark adaptometry is used to measure absolute cone and rod sensitivity. Sensitivity of the retina is measured over time, producing a biphasic curve, with a rod-cone break occurring within 5 to 10 minutes. Dark adaptometry is useful in the diagnosis and management of retinal degenerations, high myopia, vitamin A deficiency and other night blinding conditions. The two major parameters that are measured are the dark adaptometry curve and the final dark-adapted threshold.21 Fenretinide was found to slow the progression of geographic atrophy in Phase II studies. However, this drug also acted as a retinol-binding protein inhibitor, reducing dark adaptation kinetics and dark adaptometry was used as confirmation.22
In summary, a clinical electrophysiology unit can be established in any retina practice and will provide useful information in the diagnosis and management of specific disorders. It may alter the course of patient care and improve clinical outcomes. Something to consider as you evolve your practice towards optimal state-of-the-art diagnosis and care for your patients. REVIEW
Dr. Gallemore is an assistant clinical professor at Jules Stein Eye Institute, UCLA School of Medicine, Los Angeles, and founder and director of the Retina Macula Institute and Research Center, Torrance, Calif.
1. Bock M, Andrassi M, Belitsky L, Lorenz B. A comparison of two multifocal ERG systems. Doc Ophthalmol 1998-1999;97(2)157-178.
2. Hood DC, Bach M, Brigell M, Keating D, Kondo M, Lyons J, Marmor M, McCulloch D, Palmowski-Wolfe A. Guidelines for basic multifocal electroretinography (mfERG). Doc Ophthalmol 2012;124:1-13.
3. Sutter EE. Noninvasive Testing Methods: Multifocal Electrophysiology. In: Darlene A. Dartt, ed. Encyclopedia of the Eye, Vol 3. Oxford: Academic Press; 2010:142-160.
4. Marmor MF, Hood DC, Keating D, Kondo M, Seeliger MW, Miyake Y. Guidelines for basic multifocal electroretinography (mfERG). Doc Ophthalmol 2003;106:105-115.
5. Xu S, Meyer D, Yoser S, Mathews D, Elfervig JL. Pattern visual evoked potential in the diagnosis of functional visual loss.. Ophthalmology 2001;108:80-81.
6. Moschos MM, Brouzas D, Apostolopoulos M, et al. Intravitreal use of bevacizumab (Avastin) for choroidal neovascularization due to ARMD: A preliminary multifocal-ERG and OCT study. Multifocal-ERG after use of bevacizumab in ARMD. Doc Ophthalmol 2007;114:37-44.
7. Marmor MF, Fulton AB, Holder GE, Miyake Y, Brigell M, Bach M. ISCEV Standard for full-field clinical electroretinography (2008 update). Doc Ophthal 2009;118:69-77.
8. Hughes BA, Gallemore RP, Miller SS. Transport mechanisms in the retinal pigment epithelium In: The Retinal Pigment Epithelium: Current Aspects of Function and Disease. Marmor MF, Wofensberger TJ, Eds. New York, NY: Oxford Univ. Press. 1998;103-134.
9. Gallemore RP, Hughes BA, Miller SS. Retinal pigment epithelial transport mechanisms and their contributions to the electroretinogram. Prog Retinal Eye Res 1997;16:509-566.
10. Gerth C, Wright T, Heon E, Westall C. Assessment of central retinal function in patients with advanced retinitis pigmentosa. IOVS 2007;48(3):1312-1318.
11. Tremblay F, Laroche R, Becker I. The electroretinographic diagnosis of the incomplete form of congenital stationary night blindness. Vision Res 1995;35(16):2383-2393.
12. Piao C, Kondo M, Nakamura M, Terasaki H, Miyake Y. Multifocal electroretinograms in X-linked retinoschisis. IOVS 2003;44(11): 4920-4930.
13. Kaye SB, Harding SP. Early electroretinography in unilateral central retinal vein occlusion as a predictor of rubeosis iridis. Arch Ophthalmol 1988;106:353-356.
14. Dolan F, Parks S, Keating D, Dutton G, Evans A. Multifocal electroretinographic features of central retinal vein occlusion. IOVS 2003;44(11):4954-4959.
15. Bach M, Brigell MG, Hawlina M, Holder GE, Johnson MA, McCulloch DL, Meigen T, Viswanathan S. ISCEV standard for clinical pattern electroretinography (PERG) (2012 update). Doc Ophthalmol 2013;124:1-13.
16. Marmor MF, Brigell MG, Westall CA, Bach M. ISCEV standard for clinical electro-oculography (2010 update). Doc Ophthalmol 2011;122:1-7.
17. So S, Hedges T, Schuman J, Quireza M. Evaluation of hydroxychloroquine retinopathy with multifocal electroretinography. Ophthalmic Surg Lasers Imaging 2003;34(3):251-258.
18. Kretschmann U, Seeliger M, Ruether K, Usui T, Zrenner E. Spatial cone activity distribution in diseases of the posterior pole determined by multifocal electroretinography. Vision Res 1998;38:3817-3828.
19. Odom JV, Bach M, Brigell M, Holder GE, McCulloch DL, Tormene AP, Vaegan. ISCEV standard for clinical visual evoked potentials (2009 update) Doc Ophthalmol 2010;120:111-119.
20. Youl BD, Turano G, Miller DH, Towell AD, et al. The pathophysiology of acute optic neuritis. An association of gadolinium leakage with clinical and electrophysiological deficits.. Brain 1991;114:2437-2450.
21. Jackson G, Edwards J. A short-duration dark adaptation protocol for assessment of age-related maculopathy. J Ocul Biol Dis Infor 2008;1(1):7-11.
22. Caruso RC, Zujewski J, Iwata F, et al. Effects of Fenretinide (4-HPR) on Dark Adaptation. Arch Ophthalmol 1998;116(6):759-763.