Advances in OCT technology, most importantly the advent of spectral-domain OCT, have enabled retinal images to be acquired at higher speed and resolution, making it easier to identify boundaries between subtle intraretinal layers2 and details of retinal microstructural changes associated with various retinal conditions.12 In particular, the integrity of the photoreceptor layers as visualized using OCT has been demonstrated to have a more robust correlation with visual acuity than retinal thickness measurements alone, which has drawn attention to the continuity of these layers as possible predictive indicators of visual acuity in a wide variety of ophthalmic diseases that affect the macula.6-8,13-15 This review will cover the most current understanding of the identities of these outer retinal layers, or ORL, and how disruption of these layers on OCT may correlate with visual function.
Normal Anatomy of the ORL
Commercially available SD-OCT instruments have axial resolutions between 4 µm and 7 µm and transverse resolutions of approximately 15 µm, enabling the delineation of four hyper-reflective bands in the outer macula. These bands have been extensively studied and their identities have been debated in an attempt to establish terminology that could facilitate communication in the field of ophthalmology.
|
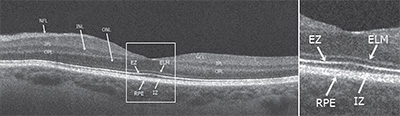
1) The external limiting membrane band (ELM) is located at the boundary between the cell bodies (nuclei) and the inner segments of the photoreceptors, and comprises clusters of junctional complexes between the Müller cells and the photoreceptors.
2) The ellipsoid zone (EZ), which was previously referred as the photoreceptor inner segment/outer segment (IS/OS) junction, is now thought to be formed mainly by mitochondria within the ellipsoid layer of the outer portion of the inner segments of the photoreceptors. In a normal fovea, the distance from the EZ line to the ELM is shorter than that from the EZ line to the RPE.
3) The interdigitation zone (IZ) corresponds to the contact cylinder represented by the apices of the RPE cells that encase part of the cone outer segments. This layer was previously referred to as cone outer segment tips (COST) or rod outer segment tips (ROST), and it is not always distinguishable from the underlying RPE layer, even in normal subjects.
4) The retinal pigment epithelial band is formed by the RPE and Bruch’s membrane (indistinguishable from each other in a normal state using current SD-OCT systems). In the fovea, this band is thicker, which indicates that choroidal structures may also contribute to the hyper-reflectivity of the RPE band at this location.
Disruption of ORL Integrity
It is widely believed that damage or disruption of the photoreceptors can be visualized on OCT as loss of integrity of the ELM, EZ and IZ bands.13,14
|
Various stages of photoreceptor damage over time have still not been clearly correlated histopathologically with OCT findings. However, OCT of retinal degenerative diseases over time has demonstrated that ELM, EZ and IZ lengths are highly correlated with each other, and disorganization seems to occur in a stepwise order: first at the IZ, followed by the EZ and finally the ELM line.16-18 The hypothesis that the photoreceptor outer segment layer is the first one to be affected in degenerative conditions, followed by damage of photoreceptor cell bodies occurring later in the process, is supported by histopathological evidence of decrease in outer segment length after retinal detachment in eyes with RD,19 and shortening of cone outer segments and death of neighboring cones following rod cell death in eyes with retinitis pigmentosa.20
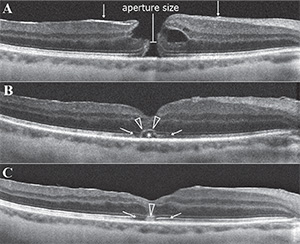
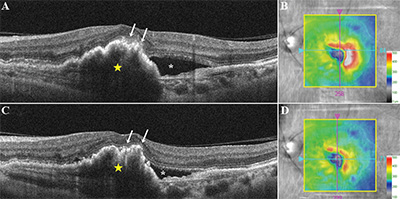
On the other hand, photoreceptor restoration as observed after macular surgery seems to occur in the opposite order. The ELM zone has been reported as the first structure to recover after macular hole closure, and its recovery has been considered a sign of intact photoreceptor cell bodies and Müller cells (See Figure 2).21 Additionally, OCT findings showed that EZ recovery is restricted to areas with intact ELM, and IZ recovery is observed only in eyes with an intact EZ and ELM line after macular hole and epiretinal membrane surgeries.22,23 These findings suggest that an intact ELM at the fovea is necessary to complete restoration of the other photoreceptor microstructures.
Correlation: ELM Integrity & VA
A relationship between the pre-treatment status of the ELM and post-treatment visual outcomes has been described for epiretinal membranes,24-26 age-related macular degeneration27 and diabetic macular edema.28 Although the presence of undisturbed ELM was considered a positive predictor of visual outcome in these diseases,26-28 there was only a weak correlation between the pre-treatment length of ELM at the fovea and post-treatment visual outcomes. In AMD patients, shorter pre-treatment ELM length was associated with a lesser degree of change in VA after treatment, however longer ELM length did not guarantee significantly greater visual improvement.27 In ERM eyes, no statistically significant association between the preoperative length of ELM and postoperative VA was found.24,25
Recovery of ELM after treatment has been more robustly correlated with visual acuity outcomes for retinal detachment,18 macular holes22,29 and age-related macular degeneration (See Figure 3).30 In eyes with retinal detachment, preservation of the ELM postoperatively was correlated with better postoperative visual acuity. After successful macular hole restoration, presence of disrupted ELM was associated with poor visual acuity31 and restoration of the EZ was restricted to areas where the ELM was also fully recovered, suggesting that restoration of the ELM is closely associated with that of the EZ.21,32 In retinal detachment eyes, preservation of the ELM postoperatively also seems to predict the subsequent restoration of the photoreceptor layer.18
Correlation: EZ Integrity & VA
Disruption or absence of the EZ has been studied extensively and has been ascribed to a variety of retinal conditions. Absence or disruption of this layer has been shown to correlate with visual outcomes and disease severity.15 In non-neovascular (dry) AMD, disruption of the EZ has been associated with visual impairment and may occur with progression of drusen or regression of subretinal drusenoid deposits; however, only moderate correlation between disruption of outer retina substructures in the foveal central subfield and visual acuity was reported.33-36 Moreover, retinal sensitivity in eyes with geographic atrophy was significantly higher in areas with an intact EZ.37 In neovascular (wet) AMD, integrity of the EZ at baseline was reported as a positive prognostic factor for visual outcome following three monthly injections of intravitreal anti-vascular endothelium growth factor medication.30 In DME eyes, EZ disruption at the fovea was reported as an important predictor of visual acuity.38,39 Increase of serum VEGF and intercellular adhesion molecule-1 (ICAM-A) levels were associated with severity of diabetic retinopathy and EZ disruption, indicating that loss of photoreceptor integrity may be a predictor of visual acuity and progression of diabetic retinopathy.39
|
Correlation: IZ Integrity & VA
The IZ is visible on OCT as a more subtle hyper-reflective line between the EZ and the RPE. A relationship between the postoperative status of IZ and visual acuity has been described for ERM,24 RD46 and macular hole.22,31 In one report, integrity of the IZ was determined to be the most robust predictor of visual acuity outcome after primary RD repair.46 After macular hole surgery, eyes with a distinct or irregular IZ had significantly better visual acuity outcomes compared with those with a disrupted or absent IZ line at the one-year visit follow-up, suggesting that restoration of the IZ line may indicate recovery of foveal photoreceptor microstructure.30
Measurement of ORL Thickness
Quantitative thickness analysis of the outer retinal layers has also been performed. The Outer Retinal Layer Thickness (ORLT)37,47 can be measured between the inner edges of the outer plexiform layer and inner boundary of the RPE. In conditions where the outer plexiform layer cannot be delineated, as in some retinal dystrophies, ORLT can be represented by the value obtained from Retinal Thickness minus the Inner Retinal Layer Thickness. At the foveal center, since there are no inner retinal layers, IRLT would be zero and the foveal RT would be equal to the ORLT. In a comparative study featuring outer retinal changes on OCT, there was a significant difference in foveal ORLT between retinal dystrophy patients and normal age and gender-matched controls (92.2 ±34.2 µm versus 199.6 ±14.1 µm, respectively).47
In another study, Foveal Outer Segment/Pigment Epithelium Thickness (FOSPET) was defined as the distance between the inner border of the highly reflective line representing the EZ and the outer border of the RPE, measured at the center of the fovea.
|
Correlation: ORT Integrity & VA
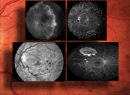
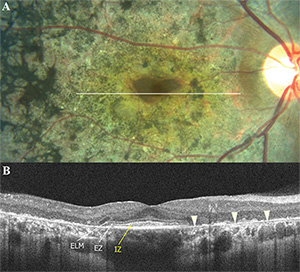
Both ORLT and FOSPET significantly correlated with visual acuity in the studies listed above.37,47,48 However, the EZ is often absent in advanced cases of retinal dystrophy, which may hamper the measurement of outer retinal thicknesses in these patients. In patients with RP, ORLT profiles averaged over 5 mm (macular) and 1.5 mm (fovea) showed more thinning of the macular ORLT than the foveal ORLT early in the disease process, which is consistent with the visual field losses beginning peripherally and then contracting concentrically later in the disease course of RP (See Figure 4). In contrast, an early loss of foveal ORLT is observed in cone-rod and Stargardt disease with relative preservation of the macular ORLT, which is consistent with the central visual loss occurring earlier in these diseases.47
In summary, photoreceptor disruption can be visualized on OCT as loss of integrity or absence of the outer retinal layers: the ELM, EZ and IZ. Disruptions of these layers on OCT have been shown to correlate with visual acuity and retinal sensitivity in many retinal diseases. The higher speed and resolution of SD-OCT has improved the accuracy and reproducibility of macular imaging and has allowed improved assessment of the integrity of the outer retina hyper-reflective bands. Further studies may enable new imaging and measurement protocols to enhance assessment of these outer retinal layers, which promises to greatly enhance the understanding of the relationship between morphologic changes in these layers and visual function in a variety of retinal diseases. REVIEW
Dr. Bonini Filho is a research fellow and Dr. Witkin is an assistant professor at the New England Eye Center, Tufts Medical Center, Boston. Dr. Filho is also on faculty at Capes Foundation at the Ministry of Education of Brazil in Brasilia, Brazil. This work was supported in part by a Research to Prevent Blindness challenge grant to the NEEC/Department of Ophthalmology–Tufts University School of Medicine, National Institutes of Health contracts and Air Force Office of Scientific Research contracts. Dr. Witkin may be reached at: ajwitkin@gmail.com.
1. Huang D, Swanson EA, Lin CP, et al. Optical coherence tomography. Science 1991;254(5035):1178-81.
2. Fujimoto JG, Bouma B, Tearney GJ, et al. New technology for high-speed and high-resolution optical coherence tomography. Ann NY Acad Sci 1998;838:95-107.
3. Keane PA, Liakopoulos S, Chang KT, et al. Relationship between optical coherence tomography retinal parameters and visual acuity in neovascular age-related macular degeneration. Ophthalmology 2008;115:2206-14.
4. Scott IU, VanVeldhuisen PC, Oden NL, et al. SCORE Study report 1: Baseline associations between central retinal thickness and visual acuity in patients with retinal vein occlusion. Ophthalmology 2009;116:504-12.
5. Hayashi H, Yamashiro K, Tsujikawa A, et al. Association between foveal photoreceptor integrity and visual outcome in neovascular age-related macular degeneration. Am J Ophthalmol 2009;148:83-9 e1.
6. Sun JK, Lin MM, Lammer J, et al. Disorganization of the retinal inner layers as a predictor of visual acuity in eyes with center-involved diabetic macular edema. JAMA Ophthalmol 2014;132:1309-16.
7. Schliesser JA, Gallimore G, Kunjukunju N, et al. Clinical application of optical coherence tomography in combination with functional diagnostics: Advantages and limitations for diagnosis and assessment of therapy outcome in central serous chorioretinopathy. Clin Ophthalmol 2014;8:2337-45.
8. Fusi-Rubiano W, Awad M, Manjunath R, et al. Spectrum of morphological and visual changes due to vitreomacular interface disorders encountered in a large consecutive cohort of patients. Eye (Lond). 2015 Jan 9. doi: 10.1038/eye.2014.313. [Epub ahead of print]
9. Alasil T, Keane PA, Updike JF, et al. Relationship between optical coherence tomography retinal parameters and visual acuity in diabetic macular edema. Ophthalmology 2010;117:2379-86.
10. Diabetic Retinopathy Clinical Research Network, Browning DJ, Glassman AR, et al. Relationship between optical coherence tomography-measured central retinal thickness and visual acuity in diabetic macular edema. Ophthalmology 2007;114:525-36.
11. Forooghian F, Stetson PF, Meyer SA, et al. Relationship between photoreceptor outer segment length and visual acuity in diabetic macular edema. Retina 2010;30:63-70.
12. Staurenghi G, Sadda S, Chakravarthy U, et al. Proposed lexicon for anatomic landmarks in normal posterior segment spectral-domain optical coherence tomography: The IN*OCT consensus. Ophthalmology 2014;121:1572-8.
13. Spaide RF, Curcio CA. Anatomical correlates to the bands seen in the outer retina by optical coherence tomography: Literature review and model. Retina 2011;31:1609-19.
14. Mitamura Y, Mitamura-Aizawa S, Katome T, et al. Photoreceptor impairment and restoration on optical coherence tomographic image. J Ophthalmol 2013;2013:518170.
15. Saxena S, Srivastav K, Cheung CM, et al. Photoreceptor inner segment ellipsoid band integrity on spectral domain optical coherence tomography. Clin Ophthalmol 2014;8:2507-22.
16. Hagiwara A, Mitamura Y, Kumagai K, et al. Photoreceptor impairment on optical coherence tomographic images in patients with retinitis pigmentosa. Br J Ophthalmol 2013;97(2):237-8.
17. Aizawa S, Mitamura Y, Hagiwara A, et al. Changes of fundus autofluorescence, photoreceptor inner and outer segment junction line, and visual function in patients with retinitis pigmentosa. Clin Experiment Ophthalmol 2010;38(6):597-604.
18. Wakabayashi T, Oshima Y, Fujimoto H, et al. Foveal microstructure and visual acuity after retinal detachment repair: imaging analysis by Fourier-domain optical coherence tomography. Ophthalmology 2009;116:519-28.
19. Sakai T, Calderone JB, Lewis GP, et al. Cone photoreceptor recovery after experimental detachment and reattachment: An immunocytochemical, morphological, and electrophysiological study. Invest Ophthalmol Vis Sci 2003;44(1):416-25.
20. Milam A, Li Z, Cideciyan A, Jacobson S. Clinicopathologic effects of the Q64ter rhodopsin mutation in retinitis pigmentosa. Invest Ophthalmol Vis Sci 1996;37(5):753-65.
21. Bottoni F, De Angelis S, Luccarelli S, et al. The dynamic healing process of idiopathic macular holes after surgical repair: A spectral-domain optical coherence tomography study. Invest Ophthalmol Vis Sci 2011;52(7):4439-46.
22. Ooka E, Mitamura Y, Baba T, et al. Foveal microstructure on spectral-domain optical coherence tomographic images and visual function after macular hole surgery. Am J Ophthalmol 2011;152(2):283-90 e1.
23. Shimozono M, Oishi A, Hata M, et al. The significance of cone outer segment tips as a prognostic factor in epiretinal membrane surgery. Am J Ophthalmol 2012;153:698-704, e1.
24. Itoh Y, Inoue M, Rii T, et al. Correlation between foveal cone outer segment tips line and visual recovery after epiretinal membrane surgery. Invest Ophthalmol Vis Sci 2013;54(12):7302-8.
25. Brito PN, Gomes NL, Vieira MP, et al. Possible role for fundus autofluorescence as a predictive factor for visual acuity recovery after epiretinal membrane surgery. Retina 2014;34(2):273-80.
26. Theodossiadis PG, Theodossiadis GP, Charonis A, et al. The photoreceptor layer as a prognostic factor for visual acuity in the secondary epiretinal membrane after retinal detachment surgery: Imaging analysis by spectral-domain optical coherence tomography. Am J Ophthalmol 2011;151:973-80.
27. Kwon Y, Lee D, Kim H, Kwon O. Predictive findings of visual outcome in spectral domain optical coherence tomography after ranibizumab treatment in age-related macular degeneration. Korean J Ophthalmol 2014;28(5):386-92.
28. Uji A, Murakami T, Nishijima K, et al. Association between hyperreflective foci in the outer retina, status of photoreceptor layer, and visual acuity in diabetic macular edema. Am J Ophthalmol 2012;153(4):710-7, 7 e1.
29. Wakabayashi T, Fujiwara M, Sakaguchi H, et al. Foveal microstructure and visual acuity in surgically closed macular holes: Spectral-domain optical coherence tomographic analysis. Ophthalmology 2010;117(9):1815-24.
30. Oishi A, Shimozono M, Mandai M, et al. Recovery of photoreceptor outer segments after anti-VEGF therapy for age-related macular degeneration. Graefe’s Arch Clin Exp Ophthalmol 2013;251(2):435-40.
31. Shimozono M, Oishi A, Hata M, Kurimoto Y. Restoration of the photoreceptor outer segment and visual outcomes after macular hole closure: Spectral-domain optical coherence tomography analysis. Graefes Arch Clin Exp Ophthalmol 2011;249(10):1469-76.
32. Theodossiadis P, Grigoropoulos V, Theodossiadis G. The significance of the external limiting membrane in the recovery of photoreceptor layer after successful macular hole closure: A study by spectral domain optical coherence tomography. Ophthalmologica 2011;225(3):176-84.
33. Hartmann KI, Gomez ML, Bartsch DU, et al. Effect of change in drusen evolution on photoreceptor inner segment/outer segment junction. Retina 2012;32:1492-9.
34. Mrejen S, Sato T, Curcio CA, Spaide RF. Assessing the cone photoreceptor mosaic in eyes with pseudodrusen and soft drusen in vivo using adaptive optics imaging. Ophthalmology 2014;121:545-51.
35. Curcio CA, Messinger JD, Sloan KR, et al. Subretinal drusenoid deposits in non-neovascular age-related macular degeneration: Morphology, prevalence, topography, and biogenesis model. Retina 2013;33:265-76.
36. Pappuru RR, Ouyang Y, Nittala MG, et al. Relationship between outer retinal thickness substructures and visual acuity in eyes with dry age-related macular degeneration. Invest Ophthalmol Vis Sci 2011;52(9):6743-8.
37. Pilotto E, Benetti E, Convento E, et al. Microperimetry, fundus autofluorescence, and retinal layer changes in progressing geographic atrophy. Can J Ophthalmol 2013;48(5):386-93.
38. Maheshwary AS, Oster SF, Yuson RM, et al. The association between percent disruption of the photoreceptor inner segment-outer segment junction and visual acuity in diabetic macular edema. Am J Ophthalmol 2010;150:63-7 e1.
39. Jain A, Saxena S, Khanna VK, et al. Status of serum VEGF and ICAM-1 and its association with external limiting membrane and inner segment-outer segment junction disruption in type 2 diabetes mellitus. Mol Vis 2013;19:1760-8.
40. Michalewska Z, Michalewski J, Cisiecki S, et al. Correlation between foveal structure and visual outcome following macular hole surgery: A spectral optical coherence tomography study. Graefe’s Arch Clin Exp Ophthalmol 2008;246(6):823-30.
41. Ko TH, Witkin AJ, Fujimoto JG, et al. Ultrahigh-resolution optical coherence tomography of surgically closed macular holes. Arch Ophthalmol 2006;124:827-36.
42. Oh J, Smiddy WE, Flynn HW, Jr., et al. Photoreceptor inner/outer segment defect imaging by spectral domain OCT and visual prognosis after macular hole surgery. Invest Ophthalmol Vis Sci 2010;51(3):1651-8.
43. Inoue M, Morita S, Watanabe Y, et al. Inner segment/outer segment junction assessed by spectral-domain optical coherence tomography in patients with idiopathic epiretinal membrane. Am J Ophthalmol 2010;150:834-9.
44. Suh MH, Seo JM, Park KH, Yu HG. Associations between macular findings by optical coherence tomography and visual outcomes after epiretinal membrane removal. Am J Ophthalmol 2009;147:473-80 e3.
45. Mitamura Y, Hirano K, Baba T, Yamamoto S. Correlation of visual recovery with presence of photoreceptor inner/outer segment junction in optical coherence images after epiretinal membrane surgery. Br J Ophthalmol 2009;93(2):171-5.
46. Gharbiya M, Grandinetti F, Scavella V, et al. Correlation between spectral-domain optical coherence tomography findings and visual outcome after primary rhegmatogenous retinal detachment repair. Retina 2012;32(1):43-53.
47. Lim JI, Tan O, Fawzi AA, et al. A pilot study of Fourier-domain optical coherence tomography of retinal dystrophy patients. Am J Ophthalmol 2008;146:417-26.
48. Witkin AJ, Ko TH, Fujimoto JG, et al. Ultra-high resolution optical coherence tomography assessment of photoreceptors in retinitis pigmentosa and related diseases. Am J Ophthalmol 2006;142:945-52.