Diagnosing glaucoma and detecting progression are challenging assignments. But as technology moves relentlessly forward, new ways to achieve these goals continue to appear. Here are three recently developed options that are showing great potential.
Detecting Dying Cells
As you know, retinal ganglion cell loss is an early indication of glaucomatous damage. The two most common methods of monitoring for glaucomatous damage—visual fields and OCT—don’t normally detect damage until a fair amount of damage has already occurred (especially visual fields, which require 20 to 40 percent of retinal cells to be damaged before it’s detectable). Thus, finding alternate ways to detect signs of damage is desirable as a means to allow earlier treatment of patients at risk.
 |
|
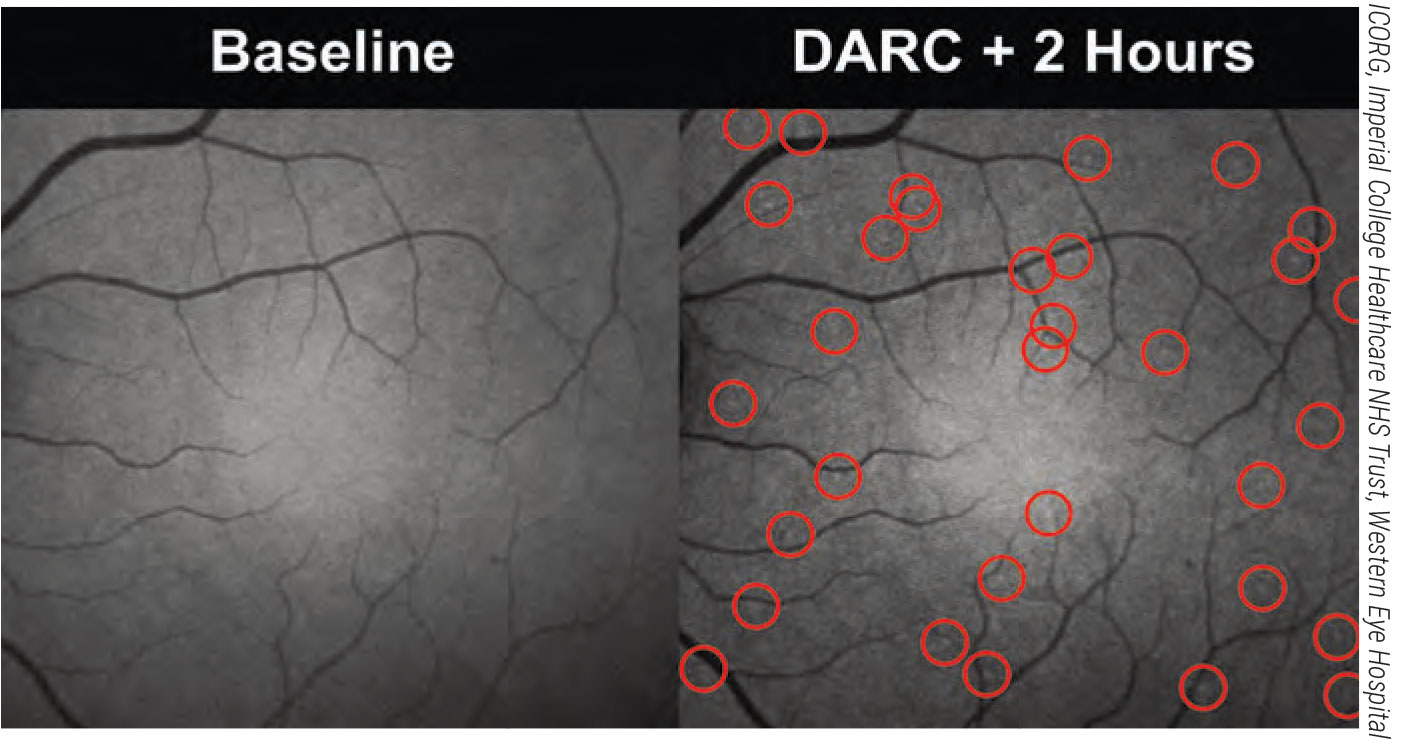
Two hours after the administration of fluorescent annexin, bright spots can be detected in the cSLO imaging of a patient’s retina. These spots correspond to cells externalizing phosphatidylserine and therefore undergoing stressful conditions. The spots have been automatically identified by a convolutional neural network algorithm and circled in red. |
One unique way to determine the condition of a patient’s retinal cells is called DARC (Detection of Apoptosing Retinal Cells). When retinal cells are in early stages of apoptosis, they externalize a cell membrane phospholipid called phosphatidylserine. Annexin A5 is a protein that has a high affinity for phosphatidylserine. In the DARC technique, developed by Francesca Cordeiro, a professor of ophthalmology at the UCL Institute of Ophthalmology and chair of ophthalmology at Imperial College in London, fluorescently labeled annexin attaches to the phosphatidylserine being externalized by cells in early stages of apoptosis. This makes them visible, so they can be imaged and measured using confocal scanning laser ophthalmoscopy. This gives researchers a way to quantify the number of retinal cells that are starting to die, in vivo.1-6 Originally, the DARC annexin was given intravenously; they’re now developing a way to apply it intranasally. (In multiple trials, involving 129 patients, intravenous annexin was found to be safe and well-tolerated.)
As you might imagine, one challenge when evaluating the condition of the retina using DARC is counting the marked cells in the captured images. Counting them manually is time-consuming, labor-intensive and shows considerable inter- and intraoperative variability.2 In response, Prof. Cordeiro’s group has developed a system using artificial intelligence to do the counting. Comparison of manual and automated counts using 66 DARC images showed that the automated counts were accurate and highly comparable to manual counting, while being faster and more reproducible. In another more recent study involving 60 images and the use of convolutional neural networks, an algorithm demonstrated 85.7-percent sensitivity and 91.7-percent specificity compared to manual counting.4
Also, this study found a significantly greater DARC count in patients who later progressed on OCT (p=0.0044). This result was based on a small sample of patients, and so will need to be confirmed by larger studies in the future. Researchers in one of the studies4 also looked at baseline age, central corneal thickness, blood pressure, visual field mean deviation, visual field index and average RNFL thickness; none of these was found to be a significant predictor of future progression. (However, they did find one OCT parameter that significantly correlated with future progression [p=0.045]: the baseline topographically correspondent abnormal sectors on OCT RNFL and BMO-MRW imaging.)
The DARC approach has been in development for two decades, and it recently completed Phase II clinical trials. Although originally tested in models of preclinical glaucoma and optic neuropathy, it’s also being tested as a potential tool for monitoring geographic atrophy, macular degeneration, Alzheimer’s, Parkinson’s and diabetes, as well as to assess the efficacy of therapies.
“DARC is an exciting new technology which is capable of delivering personalized medicine for eye diseases and beyond,” says Prof. Cordeiro. “Being able to not only treat diseases before major impairment of function, but also monitor the efficacy of treatment, will help to minimize the impact of disease on the patient’s quality of life.
“In addition to improvements to patient health care, DARC can accelerate the progress of clinical trials,” she adds. “It can be used to enrich patient populations in studies by identifying individuals expressing high retinal cell stress. Furthermore, the DARC signal can be used as a clinical endpoint to assess the degree to which treatment was able to reduce apoptosis in the eye.”
Counting Cells: Adaptive Optics
The current clinical use of OCT to diagnose or monitor glaucoma progression is based upon measuring the thickness of retinal layers, as a stand-in for the number of healthy retinal cells. Clearly this is an imperfect substitute for an actual cell count, which may explain (at least in part) the well-known lack of perfect correlation between functional visual field measurements and OCT measurements.
 |
|
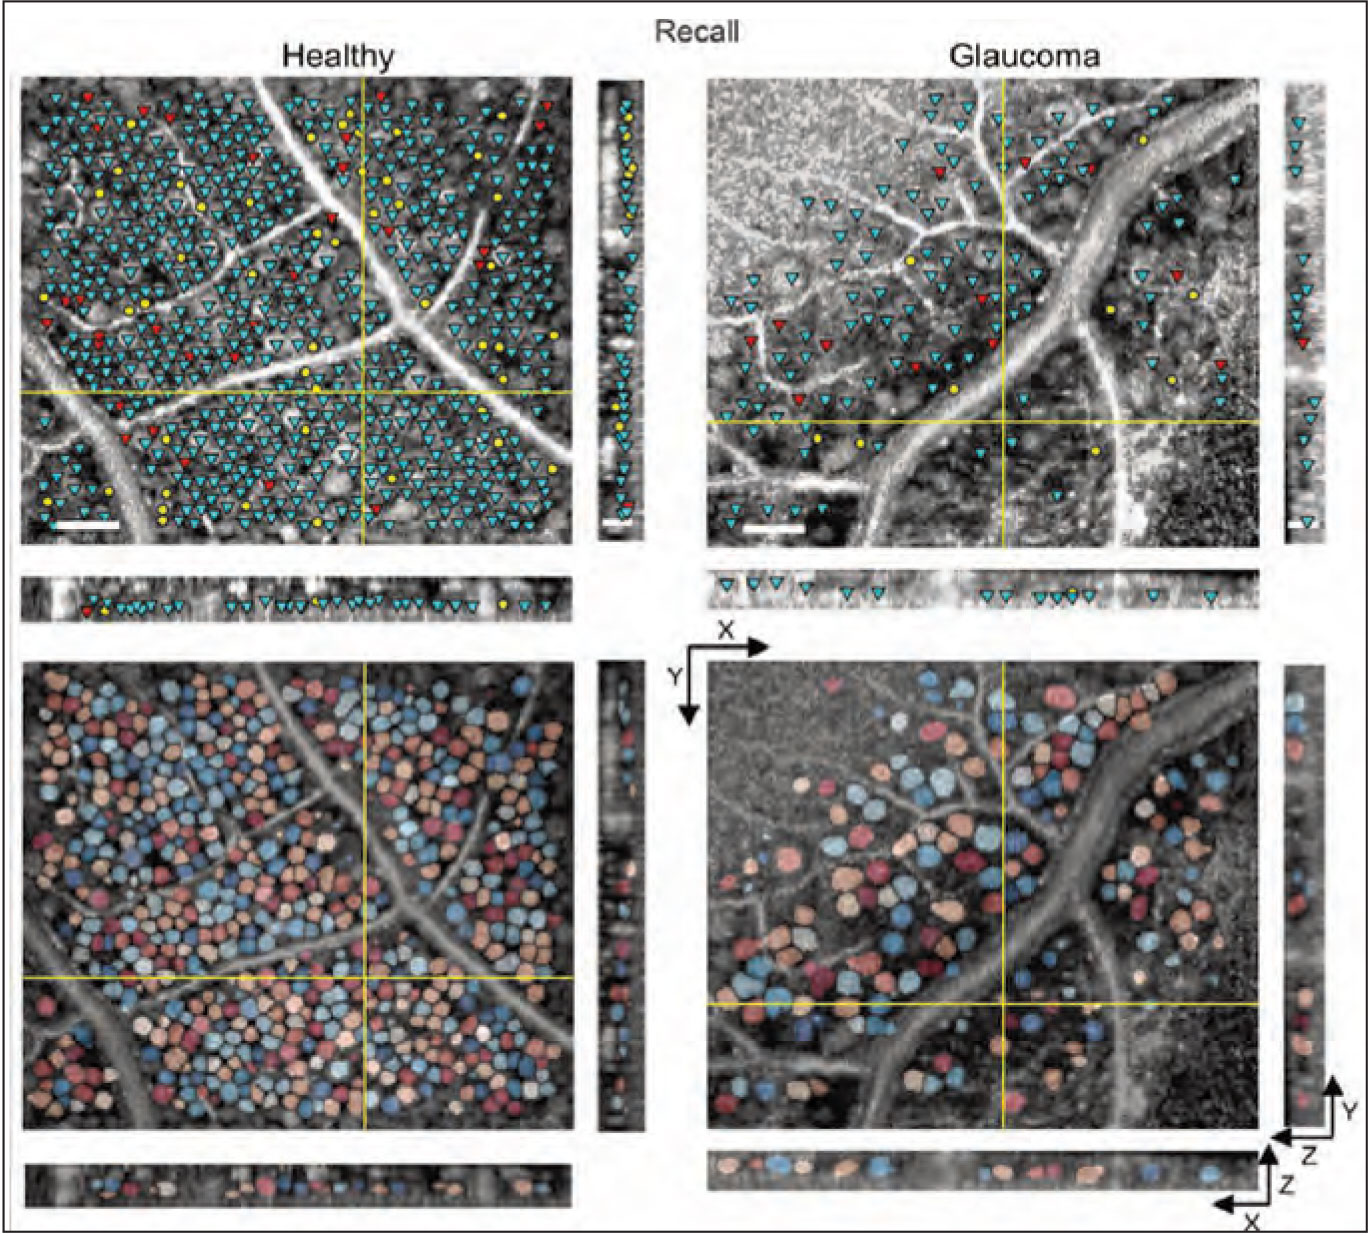
Combining OCT with adaptive optics makes it possible to do an actual retinal cell count in vivo. Above: En face (XY) and cross-sectional (XZ and YZ) slices illustrating soma detection and segmentation results in healthy vs. glaucomatous eyes. (Reprinted from Soltinian-Zadeh 20217 with permission from The Optical Society.) |
Researchers are now developing ways to do an actual count of cells present in in vivo images of the retina, using adaptive optics, which improves the limited resolution of standard imaging systems. The use of this approach has been limited by the time-consuming and subjective process of manual marking, which has made it impractical for clinical use and large studies. Thus, researchers are now pursuing the use of AI to automate this process.
A recent paper from Professor Sina Farsiu, of Duke University in Durham, North Carolina, and colleagues provided an update on this work.7 The group is using what’s called “weakly supervised deep learning,” or WeakGCSeg, to train AI to segment and measure ganglion cell layer somas via adaptive-optics OCT images. (“Weakly supervised” refers to “weak annotations”—human click-points used in the training process to obtain the segmentation masks with minimal effort.)
Their results indicate that WeakGCSeg is at least as good as human experts at this operation, and superior to other AI networks that have been tried to date. It achieved high detection performance and precise soma diameter estimates. The amount of time saved compared to manual marking was significant; manual marking took between seven and eight hours per volume; WeakGCSeg took less than three minutes per volume. Furthermore, their system was able to achieve high performance regardless of the imaging device used, or the presence of pathology or retinal eccentricity.
Other findings included:
- soma diameters in glaucoma subjects’ eyes were larger than in healthy eyes;
- there was a strong linear correlation between local ganglion cell layer density and measured thickness. (Thickness values measured by clinical OCT don’t usually correlate well with local cell density.)
- They found an increase in the correlation between structure and function (as measured by visual field) for glaucoma patients when using WeakCGSeg instead of OCT thickness measurements.
In future studies, the authors hope to investigate the structure-function relationship at different levels of disease using the WeakCGSeg system. In the meantime, they hope this system may make large-scale, multisite clinical trials feasible, leading to a much greater potential understanding of diseases involving retinal pathology.
New Iterations of Perimetry
Measuring a patient’s visual function with perimetry has always been a crucial part of diagnosing and monitoring glaucoma. However, despite improvements in the test over time, including the current availability of multiple variations in testing patterns, test strategy and stimulus size, the standard test requires a patient to come to the office and stare into a machine for several minutes. As every ophthalmologist knows, this isn’t anyone’s favorite testing experience. And in terms of collecting meaningful data, there can be problems with patient attention span, fatigue and understanding the instructions, among other issues. Furthermore, such tests are only given twice a year at most, under ordinary circumstances, for a number of reasons (including the necessity of the patient coming to your office to take the test).
With the advent of digital technology, new options for testing the visual field are being developed that don’t require coming to the office or sticking one’s face into a stationary machine. In particular, visual field testing can now be done using a computer tablet or a virtual reality headset. The disadvantage of these options is the possibility of collecting less-accurate data; the offsetting factor is that because such testing can be done outside the office—and is easier and more fun for the patient—the testing can be repeated much more frequently. Statistically speaking, having significantly more low-resolution data may be just as useful as having less frequent high-resolution data.
In terms of testing with a tablet, one of the best known is the Melbourne Rapid Fields Test, available as a free iPad app called “visualFields easy” (https://itunes.apple.com/us/app/visualfields-easy/id495389227). The test uses a moving fixation target to test up to 30 degrees of the visual field. Clinical studies have indicated that it has good test-retest repeatability and correlates well with Humphrey visual field testing.8
An obvious limitation of using a tablet for this kind of testing is the inability to control the distance from the eye to the screen, as well as having no way to monitor the patient’s level of accurate fixation. Testing using a virtual reality headset can solve those problems using gaze tracking. Essentially, the stimulus can be shown at the appropriate position relative to fixation no matter where the patient is looking. (Gyroscopes account for head movement.) Other advantages include improved user engagement because of the immersive environment, and the ability to test one eye at a time without patching the other eye.
A number of these devices are now available, including the VisuALL from Olleyes (olleyes.com), which can also test visual acuity, color vision, and contrast sensitivity; Vivid Vision (seevividly.com); Virtual Field (Virtual Field/Lombart); BioFormatix’s VirtualEye Perimeter (bioformatix.com/perimetry.html); MicroMedical Devices’ PalmScan VF2000 (micromedinc.com/our-devices/palmscan-vf2000-visual-field-perimeter); and Elisar’s eCloud Perimeter (elisar.com). Another device under development is the nGoggle, a virtual reality headset that includes embedded EEG sensors that can detect when the patient is seeing the stimulus, eliminating the need for the patient to use a manual device such as a clicker to indicate that a stimulus was seen (ngoggle.com/product).
Felipe A. Medeiros, MD, PhD, Distinguished Professor of Ophthalmology, director of clinical research and vice chair for technology at Duke University, notes that, to the best of his knowledge, these new alternatives all lack long-term validation of their potential ability to detect glaucoma progression over time. “Studies such as the Vingrys study8 of the tablet-based visual field software have demonstrated good agreement with the Humphrey test and good reproducibility,” he notes. “These devices may enable more frequent testing, which would be a very welcome addition, but they still need validation as tools for detection of progression.”
1. Cordeiro MF, Hill D, Patel R, Corazza P, et al. Detecting retinal cell stress and apoptosis with DARC: Progression from lab to clinic. Prog Retin Eye Res 2022;86:100976.
2. Bizrah M, Dakin SC, Guo L, Rahman F, et al. A semi-automated technique for labeling and counting of apoptosing retinal cells. BMC Bioinformatics 2014;515:169.
3. Guo L, Cordeiro MF. Assessment of neuroprotection in the retina with DARC. Prog Brain Res 2008;173:437-50.
4. Normando EM, Yap TE, Maddison J, et al. A CNN-aided method to predict glaucoma progression using DARC (Detection of Apoptosing Retinal Cells). Expert Rev Mol Diagn 2020;7:737-748.
5. Normando EM, Dehabadi MH, Guo L, et al. Real-time imaging of retinal cell apoptosis by confocal scanning laser ophthalmoscopy. Methods Mol Biol 2015;1254:227-37.
6. Yap TE, Davis BM, Guo L, et al. Annexins in Glaucoma. Int J Mol Sci 2018;19:4:1218.
7. Soltanian-Zadeh S, Kurokawa K, Liu Z, et al. Weakly supervised individual ganglion cell segmentation from adaptive optics OCT images for glaucomatous damage assessment. Optica 2021;8:5:642-651.
8. 6. Prea SM, Kong YXG, Mehta A, et al. Six-month longitudinal comparison of a portable tablet perimeter with the Humphrey Field Analyzer. Am J Ophthalmol 2018;190:9-16.