Royce W.S. Chen, BA; Jay S. Duker, MD; Vivek Srinivasan, MS; and James G. Fujimoto, PhD, Boston
Optical coherence tomography is a powerful, non-invasive diagnostic imaging technology that provides high-resolution, cross-sectional images of the eye and other tissues of the body.1,2 In ophthalmology, OCT has a broad range of clinical applications because of its ability to perform "optical biopsy" of the retina and the anterior segment in vivo.3 Numerous qualitative and quantitative studies on eye diseases ranging from glaucoma to age-related macular degeneration have been conducted using OCT.4-10 The Stratus OCT (Carl Zeiss Meditec), which has sold more than 6,000 units to date,11 is the most widely used OCT system in ophthalmology.
OCT was developed by our group at the Massachusetts Institute of Technology and collaborators and was reported in Science in 1991.1 The first clinical OCT studies were conducted at the
OCT Basic Concepts
OCT performs imaging by measuring the echo time delay and magnitude of backscattered or back-reflected light. Since light travels extremely quickly, it is not possible to directly measure echo time delays, and correlation techniques, known as low-coherence interferometry, are required. In low-coherence interferometry, a beam of broadband, low-coherence light from a superluminescent diode (SLD) light source is directed through a beam splitter or fiber coupler. One beam is focused on the patient's retina, and the other directed at a reference mirror. Light from the incident beam is reflected off retinal structures at different axial depths and merges with the reflected light from the reference mirror. Standard OCT systems use what is known as time-domain detection, in which the reference mirror position and delay are mechanically scanned in order to acquire an axial scan (A-scan) or measurement of light echoes versus depth. Ophthalmic OCT systems typically acquire 400 axial scans per second using time-domain detection. In order to create a standard two-dimensional cross-sectional OCT image, the beam of light is scanned in the transverse direction, and the data is displayed as a false color or grey-scale image.
Image resolution is an important parameter that determines the size of the smallest features that can be visualized. Resolution in OCT systems can be considered either axially (along the incident light beam) or transversally (perpendicular to the incident light beam). Axial image resolution is governed by the coherence length of the light source, which is inversely proportional to the bandwidth. Commercial OCT systems use low-coherence SLD sources at near infrared wavelengths of ~820 nm. The Stratus has an axial resolution of 8 to 10 µm. Research prototype ultrahigh resolution OCT systems have been demonstrated using broadband femtosecond laser or multiplexed SLD light sources; these can achieve axial image resolutions of 2 to 3 µm.12-14 Ultrahigh resolution OCT enables visualization of individual retinal layers including details of the photoreceptors. The latest commercial OCT systems have axial resolutions of 5 to 8 µm and approach ultrahigh resolution performance. 
Transverse resolution is determined by the size of focused light beam incident on the retina. Since there is a trade-off between spot size and depth of focus, most commercial OCT systems use a 20-µm transverse resolution in order to have a sufficient depth of focus. Aberrations in the eye limit the smallest focus that can be achieved to 10 to 15 µm. Recently, there has been considerable interest in using adaptive optics to correct ocular aberration to achieve high transverse resolutions on the ~4 µm scale. Adaptive optics technology promises to enable imaging of individual rods and cones.15-17
OCT achieves higher resolution than any other commercial non-invasive ophthalmic imaging technology. However, standard systems using time-domain detection have limitations because of their image acquisition speed. Total image acquisition time is limited by patient eye motion. Axial motion artifacts are removed by using digital processing to align adjacent axial scans. Although this technique results in a smoother image, it can introduce errors in retinal topography.18 In addition, the image acquisition speed limits the number of cross-sectional images that can be acquired in succession. This limits the ability to cover the retina, causing sampling errors where focal pathologies may be missed or errors in OCT image registration.
High-speed Acquisition
Recently there have been dramatic advances in OCT technology using spectral/Fourier domain detection that enable imaging speeds of ~25,000 axial scans per second, about 50 times faster than time-domain detection.19-25 Spectral/Fourier domain detection uses low-coherence interferometry to detect light echoes by using a spectrometer and high-speed CCD camera to measure the interference spectrum. The interference spectrum contains oscillations with different frequencies corresponding to different echo time delays. Therefore axial scan information can be measured by taking the Fourier transform. (A Fourier transform is a mathematical operation that extracts the frequency content of a signal.) Spectral/Fourier domain detection essentially measures all echoes of light simultaneously rather than sequentially, as in time-domain detection. Therefore, it enables a dramatic improvement in sensitivity and imaging speed. The disadvantage of spectral/ Fourier domain detection is that detection sensitivity and resolution depend on imaging depth because of limitations in spectrometer resolution. This could affect morphometric imaging, and studies are under way to investigate these effects. High-speed data acquisition offers several advantages and is key to enabling the transition from 2-D to 3-D imaging. In this article, we present data acquired using the commercially available RTVue OCT system (Optovue).
Improved Image Quality
Because of the increased speed of image acquisition, motion artifacts are minimized and images provide a more accurate representation of the retinal topography.24 Figure 1 shows a comparison of standard Stratus OCT acquired with ~8 to 10 µm axial resolution at 400 axial scans per second and high-speed RTVue OCT images of a normal retina acquired with ~5 µm axial resolution at 26,000 axial scans per second. In addition to showing a more accurate retinal contour without motion distortion, as seen subfoveally in the standard image, the high-speed image shows all major layers of the retina.
Precise, Reproducible Registration
High-speed OCT systems using spectral/Fourier domain detection enable dense raster scan patterns of multiple cross-sectional images for three-dimensional OCT (3D-OCT) data sets. Using 3D-OCT data, it is possible to generate a virtual OCT fundus image that shows landmark features such as the macula, blood vessels and optic disc. Because the OCT fundus image is created from the 3D-OCT data set, each cross-sectional OCT image is precisely and reproducibly registered to the fundus image. This ability to register OCT images to fundus features makes it possible to pinpoint a specific pathology on the fundus image and to study the same pathology on the corresponding cross-sectional OCT image. Registration promises to advance our understanding of disease mechanisms, disease progression and patient response to treatment by allowing specific pathology to be followed longitudinally from visit to visit.
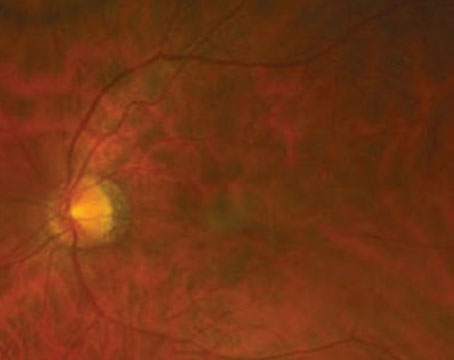
In Figure 2, a patient with non-neovascular age-related macular degeneration has multiple drusen in her right eye. Figure 2a shows the fundus photograph with a yellow arrow indicating the location of the cross-sectional OCT image. The white arrows in Figures 2a, 2b and 2c point to one particular druse identified in the fundus photograph, OCT fundus image and cross-sectional OCT image, respectively. This example demonstrates the ability to pinpoint a specific pathology and to directly correlate the finding on the fundus photograph with the same finding on the OCT image.
Three-dimensional OCT Imaging
Three-dimensional data sets from high-speed OCT systems with spectral/Fourier domain detection also have other advantages over standard OCT systems. First, retinal coverage is dramatically improved because the dense raster scan patterns collect much more information than a single OCT image. Because of this improved coverage, sampling errors are reduced and focal pathology that might be missed in single OCT images can be detected with 3D-OCT imaging.
Perhaps the most dramatic advantage of 3D-OCT data sets is the ability to view the retina and its individual layers in three dimensions, analogous to MR imaging. Clinicians may find this feature especially useful because it enables better visualization of the contours and topography of the retina and optic disc than an isolated OCT image. Combining 3D-OCT with the advantages of registration and improved coverage, one can now view the fundus, survey for pathology in any chosen area of the fundus, and then visualize how the pathology affects individual layers of the retina. 
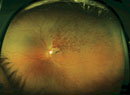
Figure 3 illustrates advantages of 3D-OCT imaging. Figure 3a shows a fundus photo of a patient with a full-thickness macular hole, and 3b shows the corresponding OCT fundus image with green lines depicting the location of specific cross-sectional images from the 3D-OCT data set, labeled 3c to 3f. Looking at the OCT images in 3d or 3f, which intersect the inferior and superior aspects of the hole respectively, one might think that the patient only has a small amount of cystoid macular edema with no hole. However, Figure 3e, an OCT image directly through the center of the hole, yields a different diagnosis.
New OCT Systems
The images presented in this article were acquired with the RTVue OCT instrument. Several other manufacturers have introduced new OCT systems to the market within the last few months. A partial list of manufacturers of OCT systems based on spectral/ Fourier domain detection includes: Bioptigen Technology; Carl Zeiss Meditec; Heidelberg Engineering; Ophthalmic Technologies; Optopol Technology; Optovue; and Topcon Medical Systems.
These instruments have similar specifications with axial image resolutions in the 5 to 7 mm range and acquisition speeds in the 20,000 to 40,000 axial scans per second range. All are based on spectral/Fourier domain detection, and all of the instruments have similar capabilities in terms of 3-D imaging. Differences will be found in imaging protocols and analysis software that will be offered. Each of these instruments promises to provide improved integration of clinical diagnostic imaging. Some combine diagnostic modalities such as fundus photography, laser angiography or scanning laser ophthalmoscopy with OCT scans; others allow the importing of infrared, autofluorescence, fluorescein angiography and indocyanine green angiography images for direct comparison with OCT images.
The next generation of OCT has arrived along with dramatically increased image-acquisition speeds and the promise of improved diagnostics. With this new wave of OCT instruments, clinicians will have more and better information available to them than ever before. Accompanying the incorporation of this generation of OCT instruments into ophthalmology clinics is a significant potential for more sensitive diagnosis, better monitoring of disease progression and response to therapy, improved understanding of disease pathogenesis, and more dynamic clinical teaching experiences. Together, these advances should further enhance the role of OCT as an important diagnostic instrument in the ophthalmology clinic.
Mr. Chen is a research intern at the
1. Huang D, Swanson E, Lin C, Schuman J. et al. Optical coherence tomography, Science 1991;254:1178-1181.
2. Fujimoto G. Optical coherence tomography for ultrahigh resolution in vivo imaging. Nature Biotechnology 2003;21:1361-1367.
3. Schuman J, Puliafito C, Fujimoto J. Optical coherence tomography of ocular diseases. 2nd edition.
4. Hee M, Izatt J, Swanson E, Huang D, et al. Optical coherence tomography of the human retina. Arch Ophthalmol 1995;113:325-332.
5. Puliafito C, Hee M, Lin C, Reichel E, et al. Imaging of macular diseases with optical coherence tomography. Ophthalmology 1995;102:217-229.
6. Hee M, Puliafito C, Wong C, Duker J, et al. Quantitative assessment of macular edema with optical coherence tomography. Arch Ophthalmol 1995;113:1019-1029.
7. Hee M, Puliafito C, Wong C, Duker J, et al. Optical coherence tomography of macular holes. Ophthalmology 1995;102:748-756.
8. Schuman J, Hee M, Arya A, Pedut-Kloizman T, et al. Optical coherence tomography: A new tool for glaucoma diagnosis. Current Opin in Ophthalmol 1995;6:89-95.
9. Schuman J, Hee M, Puliafito C, Wong C, et al. Quantification of nerve fiber layer thickness in normal and glaucomatous eyes using optical coherence tomography. Arch Ophthalmol 1995;113:586-596.
10. Hee M, Puliafito C, Duker J, Reichel E, et al. Topography of diabetic macular edema with optical coherence tomography. Ophthalmology 1998;105:360-370.
11. Carl Zeiss Meditec, Inc. Press Releases: Installation of 6000th Stratus OCT. Available at: http://www.zeiss.ca/C125679E0051C774/Contents-Frame/0ACB4604EA2A62C58825722000809503?OpenDocument. Accessed March 14, 2007.
12. Drexler W, Morgner U, Ghanta R, Kärtner F, et al. Ultrahigh-resolution ophthalmic optical coherence tomography. Nature Medicine 2001;7:502-507.
13. Drexler W, Sattmann H, Hermann B, Ko T, et al. Enhanced visualization of macular pathology with the use of ultrahigh-resolution optical coherence tomography. Arch Ophthalmol 2003;121:695-706.
14. Ko T, Fujimoto J, Schuman J, Paunescu L, et al. Comparison of Ultrahigh- and Standard-Resolution Optical Coherence Tomography for Imaging Macular Pathology. Ophthalmology 2005;112:1922.
15. Fernandez EJ, Povazav B, Hermann B, et al. Three-dimensional adaptive optics ultrahigh resolution optical coherence tomography using a liquid crystal spatial light modulator. Vision Res 2005;45:3432-44.
16. Zawadzki R, Jones S, Olivier S, et al. Adaptive-optics optical coherence tomography for high-resolution and high-speed 3D retinal in vivo imaging. Opt Express 2005;13:8532-46.
17. Zhang Y, Cense B, Rha J, Jonnal R, et al. High-speed volumetric imaging of cone photoreceptors with adaptive optics spectral-domain optical coherence tomography. Optics Express;14:4380-4394.
18. Swanson E, Izatt J, Hee M, D. Huang, et al. In vivo retinal imaging by optical coherence tomography. Optics Letters 1993;18:1864-1866.
19. Fercher A, Hitzenberger C, Kamp G, Elzaiat S. Measurement of Intraocular Distances by Backscattering Spectral Interferometry. Optics Communications 1995;117:43-48.
20. Wojtkowski M, Leitgeb R, Kowalczyk A, Bajraszewski T, et al. In vivo human retinal imaging by Fourier domain optical coherence tomography, J Biomedical Optics;2003;7:457-463.
21. Nassif N, Cense B, Park B, Pierce M, et al. In vivo high-resolution video-rate spectral-domain optical coherence tomography of the human retina and optic nerve. Optics Express 2004;12.
22. Leitgeb R, Drexler W, Unterhuber A, Hermann B et al. Ultrahigh resolution Fourier domain optical coherence tomography. Optics Express;12:2156-2165.
23. Wojtkowski M, Bajraszewski T, Gorczynska I, Targowski P, et al. Ophthalmic imaging by spectral optical coherence tomography. Am J Ophthalmol;138:412-9.
24. Wojtkowski M, Srinivasan V, Fujimoto J, Ko T, et al. Three-dimensional retinal imaging with high-speed ultrahigh-resolution optical coherence tomography. Ophthalmology 2005;112:1734-46.
25. Srinivasan V, Wojtkowski M, Witkin A, Duker J, et al. High-definition and 3-dimensional imaging of macular pathologies with high-speed ultrahigh-resolution optical coherence tomography. Ophthalmology 2006;113:2054.