As we enter the dawn of dry-eye season and close the chapter on another year, it’s an appropriate time to reflect on the current state of dry-eye diagnosis and treatment as well as the prospects for therapeutic development in the coming year and beyond.
In August, we ran through a list of dry-eye diagnostic tests, and discussed the critical value of a thorough patient history and a comprehensive discussion between doctor and patient about the patient’s ocular health. We also reviewed the standard clinical tests, namely fluorescein, rose bengal or lissamine green staining, tear-film breakup time, Schirmer’s tests and fluorophotometry, that are the current diagnostics used in formulating a dry-eye diagnosis. While these tests provide the clinician with clues for diagnosis, it’s clear that there’s room for improvement.
This month, we’ll continue our earlier discussion of testing by reviewing newer technologies and approaches and discussing the pros and cons of this next generation of diagnostic tools.
A Closer Look at Tears
A major focus in dry eye in recent years has been the role of tear composition and volume. For the past century, physicians have used German ophthalmologist Otto Schirmer’s test to measure tear volume, and while 100 years may be enough for any test, it remains an important tool for assessing dry eye. Schirmer’s is a simple, convenient test that involves placing a paper wick in contact with the ocular surface to measure tear production. Beyond the issue of reflex tearing, the main drawback with the test is that it’s not predictive in terms of disease severity, which limits its value as a diagnostic.
What are the available alternatives to the Schirmer’s test? One of the best methods for measuring tear volume in a non-invasive way is based on measuring tear meniscus height.1 While this can be done by simple visual inspection, instrument-based methods have the ability to measure tear volume in a precise, objective way. A recent study took values for meniscus volumes measured by optical coherence tomography and compared them to the results from other established dry-eye metrics, and found both upper- and lower-lid volumes were significantly correlated with the degree of corneal fluorescein staining in both Sjögren’s syndrome and non-Sjögren’s dry-eye patients.2 This type of objective measure would be particularly important for studies of dry-eye drugs designed to increase tear flow, such as cyclosporine.
In addition to tear volume, tear osmolarity is also an important biomarker for dry-eye disease, as we discussed in Therapeutic Topics in July of this year. The 2007 International Dry Eye Workshop stated that part of the standard definition of dry eye is that it is “… accompanied by increased osmolarity of the tear film and inflammation of the ocular surface.”3 The development of the TearLab osmometer (TearLab, San Diego) has addressed this important aspect of the disease and made it possible to conduct osmolarity measurements in a clinical setting. Despite this, the TearLab system is not a stand-alone diagnostic tool, and has yet to significantly impact the treatment of dry eye or the development of new therapeutics. According to the Food and Drug Administration, it’s to be used “in conjunction with other methods of clinical evaluation,”4 which may be due to some inconsistencies in osmolarity measures from the TearLab system. While some reports have confirmed the reliability of the device,5 another reported high variability between examiners. The same study suggested that osmolarity values measured with the TearLab device vary significantly depending on where precisely within the tear meniscus the tear film sample is collected. (Wunderlich K, et al. IOVS 2011;52:ARVO E-Abstract 3797) It’s noteworthy that changes in osmolarity haven’t been used as a clinical endpoint in any registered trials of new dry-eye therapeutics on the government website
clinicaltrials.gov. Clearly, additional studies correlating accurate measures of osmolarity with other dry-eye signs and symptoms would be useful in developing a better understanding of the relationship between tear osmolarity and dry-eye disease.
New Tools and Technologies
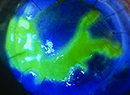
What about other dry-eye diagnostics? Like the Schirmer’s test, tear-film breakup time has been a standard dry-eye test for many years. TFBUT has traditionally been measured using fluorescein dye during a “forced-stare” protocol. The stability of the tear film is observable by the breakup of the fluorescent tear film coating the ocular surface (usually in about five to 15 seconds). While the measurements are both reliable and reproducible (dry-eye patients tend to have low TFBUTs), they often don’t distinguish dry-eye sufferers from those without signs or symptoms of the disease. To address this, several recent studies have used video capture methods to accomplish two objectives: to measure breakup under more natural conditions than the forced stare; and to examine a related parameter of tear-film stability, tear-film breakup area, or BUA.6,7
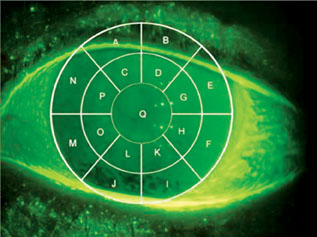 |
| Video images of corneal fluorescein staining can be manually scored with the aid of a transect grid such as this. However, automated methods of staining analysis are likely to obviate the need for such manual scoring in the near future. |
In 2008, we first described the idea of the Ocular Protection Index to quantify the interaction between TFBUT and IBI.8 While the use of the OPI provides a context for determining the clinical relevance of TFBUT, increased understanding of the complexities of blink physiology and tear-film breakup has prompted work on alternative methods for evaluation of ocular surface protection under natural visual conditions. The Video Capture Manual Analysis technique provides retrospective analysis of video data of fluorescein-stained eyes while a subject watches television.9 A key feature of the VCMA method is that it allows for the simultaneous capture of TFBUT, IBI and tear-film BUA while the subject blinks normally. The VCMA was able to successfully distinguish between dry eye and normal subjects, and therefore provides a clinically relevant analysis of tear-film stability measured in the context of a natural blink pattern.
Another parameter that’s often part of clinical evaluation of dry eye is conjunctival hyperemia. Historically, this evaluation has been done subjectively by a clinical grader using a pre-existing scale. For our own part, researchers here at Ora recently developed objective measures of redness using video capture in combination with software algorithms designed to identify and quantify redness patterns and intensities. This should allow for greater sensitivity and reproducibility of redness grading scores.
The same strategy for automated analysis can be used to improve upon the VCMA approach to studies of tear-film dynamics. Several recent studies (Griffin J, et al. IOVS 2011;52:ARVO E-Abstract 384; Lafond A, et al. IOVS 2011;52:ARVO E-Abstract 3845; Contractor M, et al. IOVS 2011;52:ARVO E-Abstract 3830) described the addition of automated analysis to VCMA data in a method designated OPI 2.0. This system, which is designed to automate the process of BUA analysis, has the same features as the VCMA (simultaneous measurement of TFBUT, IBI and BUA) while providing a more precise metric for BUA. This approach also reduces the human error inherent in the manual analysis while increasing the speed of the overall data assessment process. The OPI 2.0, first described at this year’s meeting of the Association for Research in Vision and Ophthalmology, should have a significant impact on the process of dry-eye therapeutic development.
A Better Image of the Surface
For those focused on retinal disease, confocal microscopy has been a diagnostic mainstay for years. More recently, confocal devices have been developed for use in the anterior segment. Several case reports published this year provide specific examples of the ways in which confocal imaging—either traditional confocal or laser scanning confocal—can enhance our ability to quickly and accurately diagnose cases of keratitis or conjunctivitis.10,11 These devices are also proving their utility in chronic allergy or infection, where the extent of disease can be associated with the degree of immune cell infiltration or epithelial cell integrity.12,13 Increases in dendritic cell infiltration into the central cornea can readily be imaged, as can changes in density of nerve endings in the same tissue that are typical of dry-eye disease.13 The true value of these enhanced imaging techniques is their ability to objectively and non-invasively assess the physiological state of the tissues of the anterior segment, including the nerves, endothelium, epithelium and stroma.
 |
Recent imaging studies are also adding to our ability to diagnose disorders of meibomian gland function.16,17 These studies demonstrate how LSCM can identify critical features of MG health, including mucocutaneous cell density, acinar unit density, meibum gland orifice structure and MG inflammation. As with imaging studies of corneal innervation, a better understanding of meibomian gland disease is likely to impact future therapies for dry eye. We expect that application of LSCM imaging of the ocular surface will provide improved diagnostics for many conditions, and in doing so will make it possible to develop enhanced diagnostic endpoints in future clinical trials.
Putting the New Tools to Work
As we emphasized in the previous column on dry-eye diagnostics, nothing can or will eliminate the need for a good patient history and examination in the diagnosis of dry eye. Despite this, it’s reasonable to presume—or, at least, hope—that among the technologies we’ve considered, at least one will emerge as an effective tool to aid in the early, accurate identification of the disease in all its various subtypes. In addition, defining patient subpopulations is also critical to therapeutic progress, and many studies now focus on those patients with aqueous tear-deficient dry eye or patients with dry eye due to Sjögren’s syndrome. We see this combination of an improved ability to identify patient subgroups and the availability of an extended array of objective, quantifiable signs as keys to dry-eye treatments in the future.
There’s a wealth of new dry-eye treatments in the pipeline, including therapies from SARcode, Mimetogen and Regenerex. If past experience is any predictor, we fully expect that the new technologies we’ve described should jump-start development of these and other new dry-eye therapies in 2012 and beyond.
Dr. Abelson, a clinical professor of ophthalmology at Harvard Medical School and a senior clinical scientist at the Schepens Eye Research Institute, consults in ophthalmic pharmaceuticals. He wishes to thank the medical communications staff at Ora Inc., who contributed to this report.
1. Harrison WW, Begley CG, Liu H, et al. Menisci and fullness of the blink in dry eye. Optom Vis Sci 2008;85:706-14.
2. Chen Q, Zhang X, Cui L, et al. Upper and lower tear menisci in Sjögren’s syndrome dry eye. Invest Ophthalmol Vis Sci 2011;Oct 24. [Epub ahead of print]
3. The epidemiology of dry eye disease: Report of the Epidemiology Subcommittee of the International Dry Eye Work Shop. [No authors listed] Ocul Surf. 2007; 5:93-107.
4. www.tearlab.com/pdfs/certs/FDA_Approval_letter_(6-2-09).pdf
5. Jacobi C, Jacobi A, Kruse FE, Cursiefen C. Tear film osmolarity measurements in dry eye disease using electrical impedance technology. Cornea 2011;30:1289-1292
6. Abelson MB, Ousler GW, 3rd, Nally LA, Welch D, Krenzer K. Alternative reference values for tear film break up time in normal and dry eye populations. Adv Exp Med Biol 2002;506(Pt B):1121.
7. Begley CG, Himebaugh N, Renner D, et al. Tear breakup dynamics: A technique for quantifying tear film instability. Optom Vis Sci 2006;83:15-21.
8. Ousler GW, 3rd, Hagberg KW, Schindelar M, Welch D, Abelson MB. The ocular protection index. Cornea 2008;27:509-513.
9. Abelson R, Lane KJ, Angjeli E, Johnston P, Ousler G, Montgomery D. Measurement of ocular surface protection under natural blink conditions. Clin Ophthalmol 2011;5:1349-1357.
10. Labbe A, Gabison E, Cochereau I, Baudouin C. Diagnosis of fungal keratitis by in vivo confocal microscopy: A case report. Eye 2011;25:956–958.
11. Mariotti SP, Pascolini D, Rose-Nussbaumer J. Trachoma: Global magnitude of a preventable cause of blindness. Br J Ophthalmol 2009;93:563-8.
12. Ono SJ, Lane K. Comparison of effects of alcaftadine and olopatadine on conjunctival epithelium and eosinophil recruitment in a murine model of allergic conjunctivitis. Drug Design, Devel, Therapy 2011;5:77-84.
13. Cruzat A, Witkin D, Baniasadi N, et al. Inflammation and the nervous system: The connection in the cornea in patients with infectious keratitis. Invest Ophthalmol Vis Sci 2011;52:5136-43.
14. Benıtez-del-Castillo JM, Acosta MC, Wassfi MA,et al. Relation between corneal innervation with confocal microscopy and corneal sensitivity with noncontact esthesiometry in patients with dry eye. Invest Ophthalmol Vis Sci 2007;48:173–181.
15. Villani E, Galimberti D, Viola F, Mapelli C, Ratiglia R. The Cornea in Sjögren’s Syndrome: An In Vivo Confocal Study. Invest Ophthalmol Vis Sci 2007;48:2017–2022.
16. Villani E, Beretta S, De Capitani M et al. In vivo confocal microscopy of meibomian glands in Sjögren’s syndrome. Invest Ophthalmol Vis Sci 2011;52:933-9.
17. Wang Y, Le Q, Zhao F, et al. Application of in vivo laser scanning confocal microscopy for evaluation of ocular surface diseases: Lessons learned from pterygium, meibomian gland disease and chemical burns. Cornea 2011;30:S25-8.